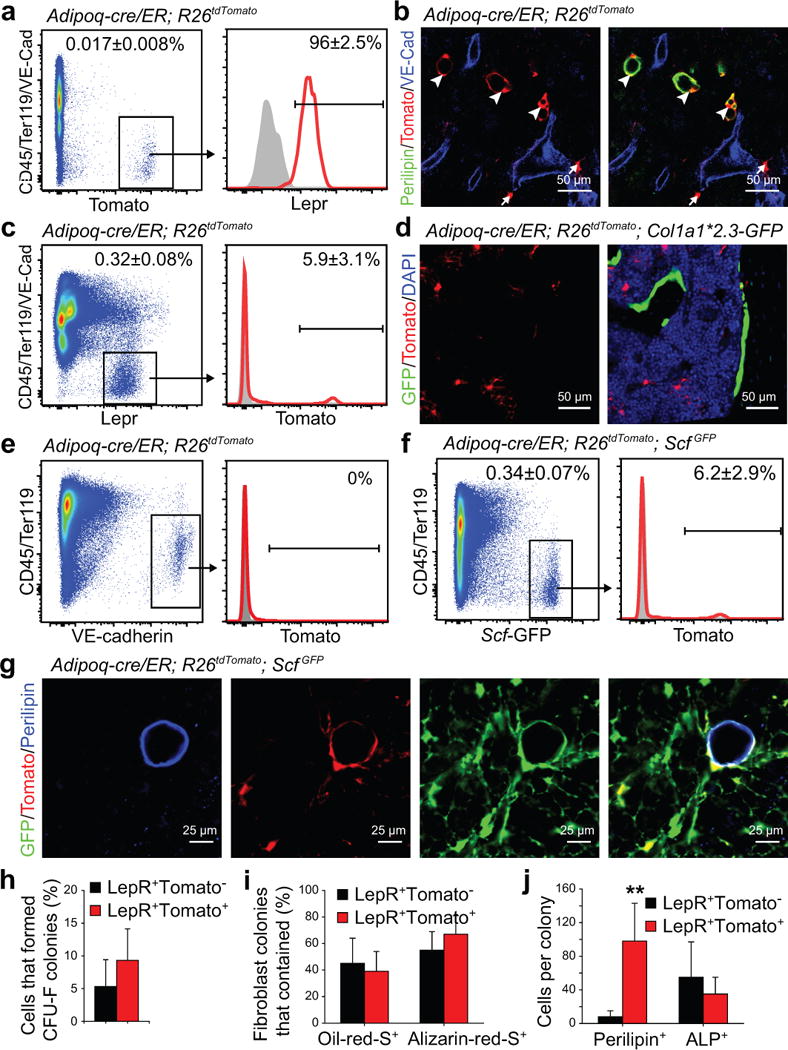
Figure 4. Adipoq-Cre/ER recombines in most adipocytes and in a subset of LepR+ stromal cells in the bone marrow.

(a) 0.017±0.008% of bone marrow cells were Tomato+ in enzymatically dissociated bone marrow cells from Adipoq-cre/ER; R26tdTomato mice at 4 weeks after tamoxifen administration.
(b) Adipoq-cre/ER; R26tdTomato mice exhibited Tomato expression by perilipin+ adipocytes (arrowheads) and a subset of perilipin negative stromal cells (arrows) in the bone marrow.
(c) Only 5.9±3.1% of LepR+ stromal cells were Tomato+ in the bone marrow of Adipoq-cre/ER; R26tdTomato mice at 4 weeks after tamoxifen administration.
(d) Tomato expression was rarely detected in bone-lining GFP+ osteoblasts from Adipoq-cre/ER; R26tdTomato; Col1a1*2.3-GFP mice.
(e) Tomato expression was not detected in VE-cadherin+CD45/Ter119− endothelial cells in the bone marrow of Adipoq-cre/ER; R26tdTomato mice at 4 weeks after tamoxifen administration.
(f) Only 6.2±2.9% of Scf-GFP+ stromal cells were Tomato+ in the bone marrow of Adipoq-cre/ER; R26tdTomato; ScfGFP mice at 4 weeks after tamoxifen administration.
(g) While not detected by flow cytometry, perilipin+ adipocytes in bone marrow sections from Adipoq-cre/ER; R26tdTomato; ScfGFP mice were consistently positive for Scf-GFP and Tomato.
(h) Percentages of LepR+Tomato− or LepR+Tomato+ stromal cells from Adipoq-cre/ER; R26tdTomato mice that formed CFU-F colonies in culture.
(i) Percentage of CFU-F colonies that contained Oil-red-O+ adipocytes or Alzarin-red-S+ osteoblastic cells.
(j) The average numbers of perilipin+ adipocytes or alkaline phosphatase+ (ALP+) osteogenic cells that spontaneously differentiated per CFU-F colony after 1 week of culture in DMEM plus 20% FBS (n=53 colonies from 3 mice; 3 independent experiments). A two-way ANOVA with Sidak’s multiple comparisons test was used to assess statistical significance. **P<0.01.
All data in Figure 4 represent mean±SD and representative images from n=3 mice in 3 independent experiments.
