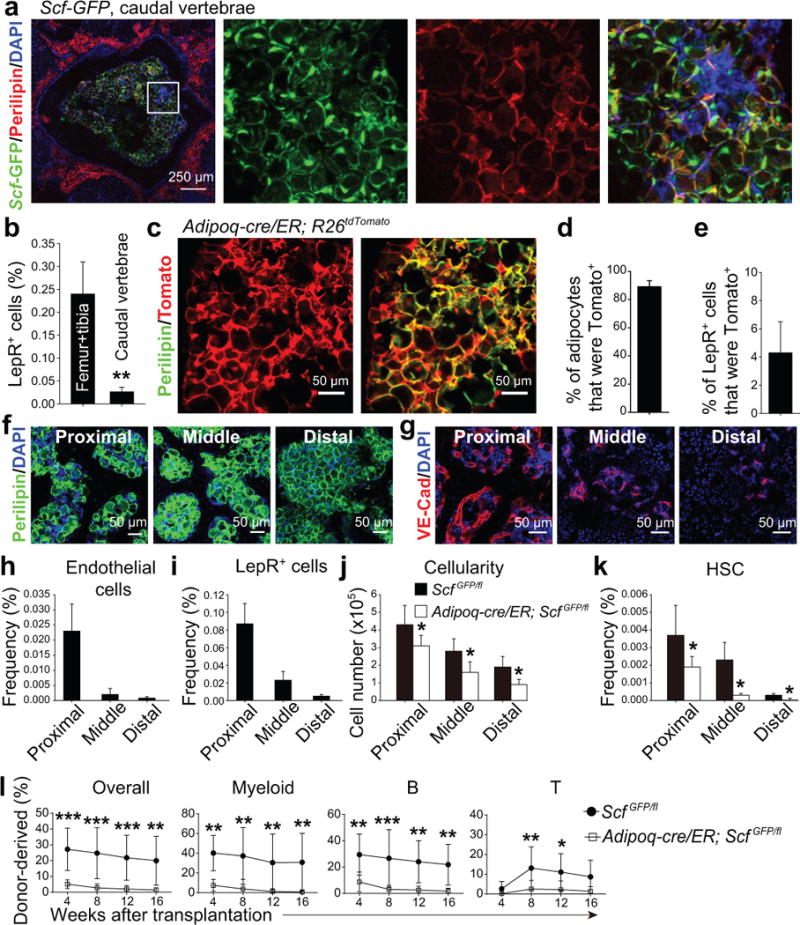
Figure 7. Scf from adipocytes is required for normal HSC frequency and hematopoiesis in the caudal vertebrae of normal young adult mice.

(a) Whole-mount imaging of cross sections of a caudal vertebra showing large numbers of adipocytes in the bone marrow (representative image from 3 independent experiments performed on CA1-CA5 vertebrae).
(b) The frequency of LepR+ stromal cells in bone marrow from femurs and tibia versus caudal vertebrae (CA1-CA5). Data represent mean±SD from n=3 mice in 3 independent experiments. A two-tailed Student’s t-test was used to assess the statistical significance between genotypes (data were log2-transformed; **P<0.01).
(c–e) Adipoq-Cre/ER recombined in nearly all adipocytes (c, d) but only in a small subset of LepR+ stromal cells (e) four weeks after tamoxifen treatment. Data represent mean±SD from n=3 mice in 3 independent experiments.
(f) Adipocytes were abundant in all caudal vertebrae (proximal=CA1-CA5; middle=CA6-CA10; distal=CA11-CA16; representative images from 3 independent experiments).
(g) Bone marrow vascularity progressively declined in caudal vertebrae (representative images from 3 independent experiments).
(h–k) Endothelial cell frequency (h), LepR+ cell frequency (i), total bone marrow cellularity (j), and HSC frequency (k) in caudal vertebrae from Adipoq-cre/ER; ScfGFP/fl mice and ScfGFP/fl controls that had been administered tamoxifen 4 weeks earlier. Data represent mean±SD from n=5 mice/treatment in 3 independent experiments. Paired, two-tailed Student’s t-tests with Holm-Sidak’s multiple comparisons tests were used to assess statistical significance for j and k (*P<0.05).
(l) Competitive reconstitution assay in which 5×10⁵ donor bone marrow cells from middle caudal vertebrae were transplanted along with equal numbers of recipient bone marrow cells into irradiated recipient mice. All data represent mean±SD (n=10 recipient mice/genotype from 3 independent experiments). The statistical significance of differences was assessed using two-way ANOVAs with Sidak’s multiple comparisons tests (*P<0.05, **P<0.01, ***P<0.001).
