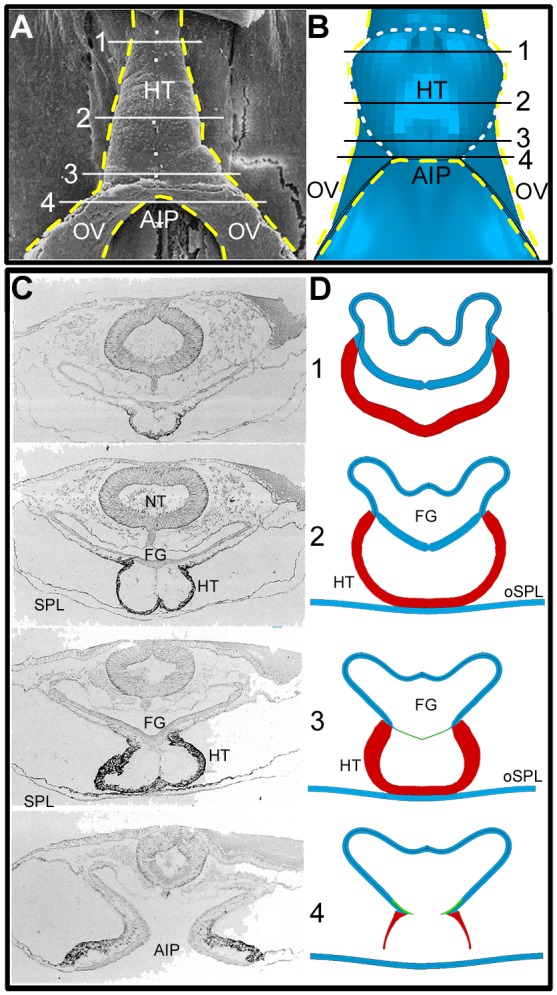
Fig. 7.

Comparison of HH10 heart shapes: experiment and model (ventral view). (A) Scanning electron microscopy image [reproduced, with permission, from Männer (2000)]. (B) Model at HH10. Modeled half of embryo is combined with its mirror image to aid visualization. Yellow dashed lines represent outline of heart tube (HT) and omphalomesenteric veins (OVs); white dashed line in B indicates fused heart-field region in the model. OVs represent posterior regions of inner splanchnopleure (iSPL) that have not yet fused. (C,D) Transverse cross-sections of HH10 chick embryo and model at locations indicated by white/black lines in A and B, respectively. Thin green lines in model sections 3 and 4 are the contracting AIP border region. [Experimental sections are reproduced, with permission, from De Jong et al. (1990).] AIP, anterior intestinal portal; FG, foregut; NT, neural tube.
