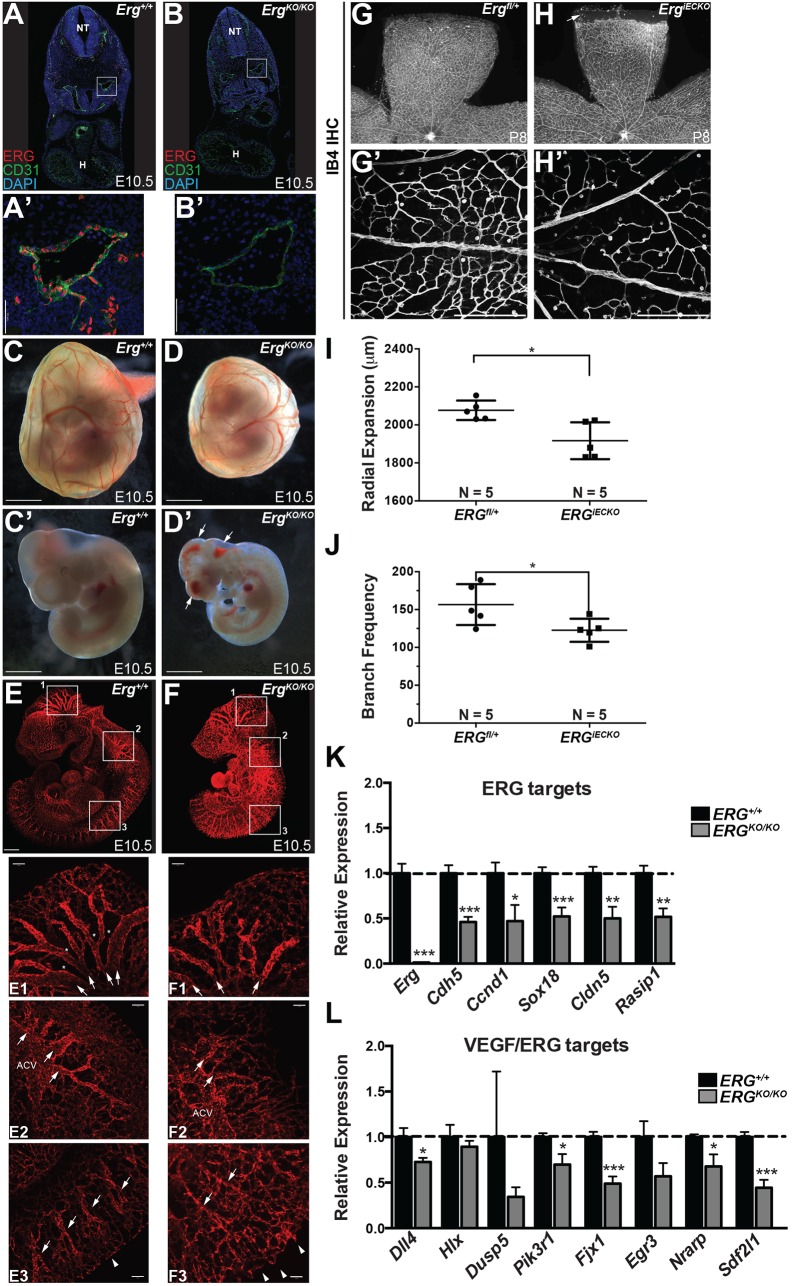
Fig. 7.
ERG loss of function alters angiogenesis in vivo. (A-B′) Confocal microscopy following staining for ERG and CD31 on mouse embryo cryosections. Magnified views (A′,B′) of the dorsal aorta (boxed areas) reveal loss of ERG, and decreased CD31 (PECAM1), in ErgKO/KO embryos compared with wild-type littermate controls. Nuclei are stained with DAPI (blue). H, heart; NT, neural tube. (C-D′) Representative whole-mount bright-field images of E10.5 Erg+/+ (C,C′) and ErgKO/KO (D,D′) yolk sacs and embryos. Arrows indicate hemorrhage. (E,F) Representative light-sheet microscopy images of endomucin-stained blood vessels in E10.5 Erg+/+ (E) and ErgKO/KO (F) embryos. Boxed areas 1, 2 and 3 are shown below the whole-mount images at a higher magnification. Arrows in box 1 denote remodeled, larger caliber vessels, which are smaller in ErgKO/KO animals, and asterisks denote remodeled areas devoid of vessels, which are reduced in ErgKO/KO embryos compared with Erg+/+. In box 2, the anterior cardinal vein (ACV), although present in the knockouts, showed a decreased diameter and the major large caliber vessels sprouting from it (denoted by arrows) were also smaller and more tortuous. In box 3, the remodeled ISVs are denoted by arrows, and the sprouting front (dorsal-most edge) is denoted by arrowheads. The vascular front appears less uniform in knockouts and the ISVs appear less organized compared with wild-type littermates. (G-H′) Representative images of the total retinal vasculature (G,H) and magnified view of the proximal region (G′,H′) stained with IB4 in Ergfl/+ (G,G′) and ErgiECKO (H,H′) retinas at P8 following tamoxifen administration at P1 and P3. The arrow in H indicates an avascular area in ErgiECKO retina. (I) Quantification of radial expansion of the IB4+ vasculature within the P8 retina (n=5 for both genotypes). (J) Vascular density as determined by quantification of IB4+ branches in the proximal retinal vascular plexus at P8 (n=5 for each genotype). (K,L) ECs were isolated by FACS from Erg+/+ or ErgKO/KO embryos at E10.5. qRT-PCR was performed on the indicated VEGF-independent, ERG-dependent (K) and VEGF-responsive, ERG-dependent (L) genes [n=14 (Erg+/+) and 9 (ErgKO/KO)]. Scale bars: 50 µm (A′,B′); 1000 µm (C-D′); 500 µm (E,F); 100 µm (E1-3,F1-3,G′,H′).

