Fig. 2.
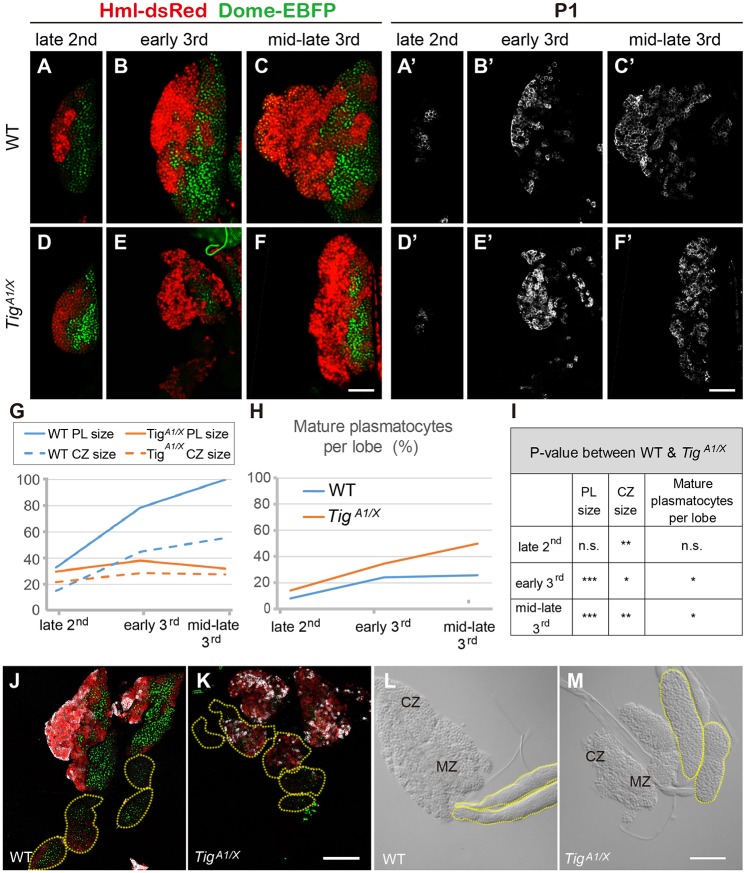
Tig mutants display precocious differentiation of plasmatocytes in the 1° and 2° lobes of the LG. (A-F′) Confocal images of PLs from late 2nd (A,D), early 3rd (B,E) and mid/late 3rd (C,F) instar larvae from w1118 (A-C) or TigA1/X mutants (D-F). The CZ and MZ are marked by Hml-dsRed (red) and Dome-EBFP (green), respectively (A-F), and plasmatocytes via P1 immunostaining (A′-F′). (G) The decrease in PL and CZ size in the Tig mutants manifested during the 3rd instar larval stage. (H) The precocious appearance of P1+ plasmatocytes in Tig mutants began in early 3rd instars. Data are mean values. (I) Summary of the statistical analysis in G,H. *P<0.05, **P<0.01, ***P<0.001, n.s., not significant. More information on these data is available in Table S2. (J,K) Confocal images of mid 3rd instar larval LGs of wild type and Tig mutants in which the 2° lobes are highlighted (yellow dashed lines), marked by Hml-dsRed (red), Dome-EBFP (green) and immunostained for P1 protein (white). The 2° lobes of Tig mutants have higher P1 staining and Hml-dsRed expression. (L,M) DIC images of control and Tig mutant 2° lobes (yellow dashed lines). Most 2° lobes of wild-type animals displayed smooth tightly packed cells, similar to the MZ of the PL. In contrast, cells in the 2° lobes of most Tig mutants appeared larger and more loosely packed, as is typically found in the CZ of the PL. Further description of the phenotypic range of the 2° lobes is provided in Table S3. Scale bars: 50 µm.

