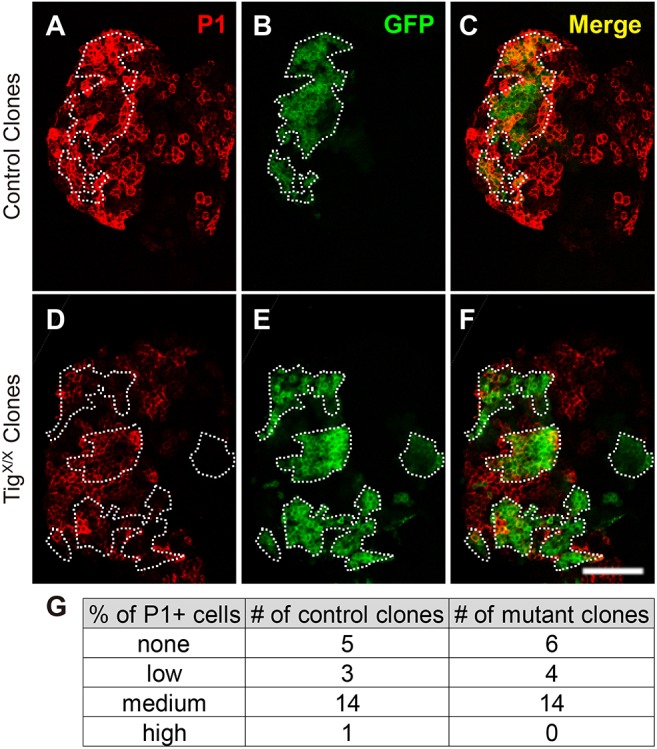
Fig. 4.

Tig mutant clones in the PL do not display a higher number of plasmatocytes. (A-F) Confocal images of PLs stained for P1 (red) and containing MARCM clones of control (A-C) and TigX mutant clones (D-F). Clones are marked by GFP (green). (G) Table summarizing P1 staining levels in control and Tig mutant clones. No obvious difference in P1 expression was observed inside the Tig mutant clones. Animals were reared at 25°C. Scale bar: 50 µm.
