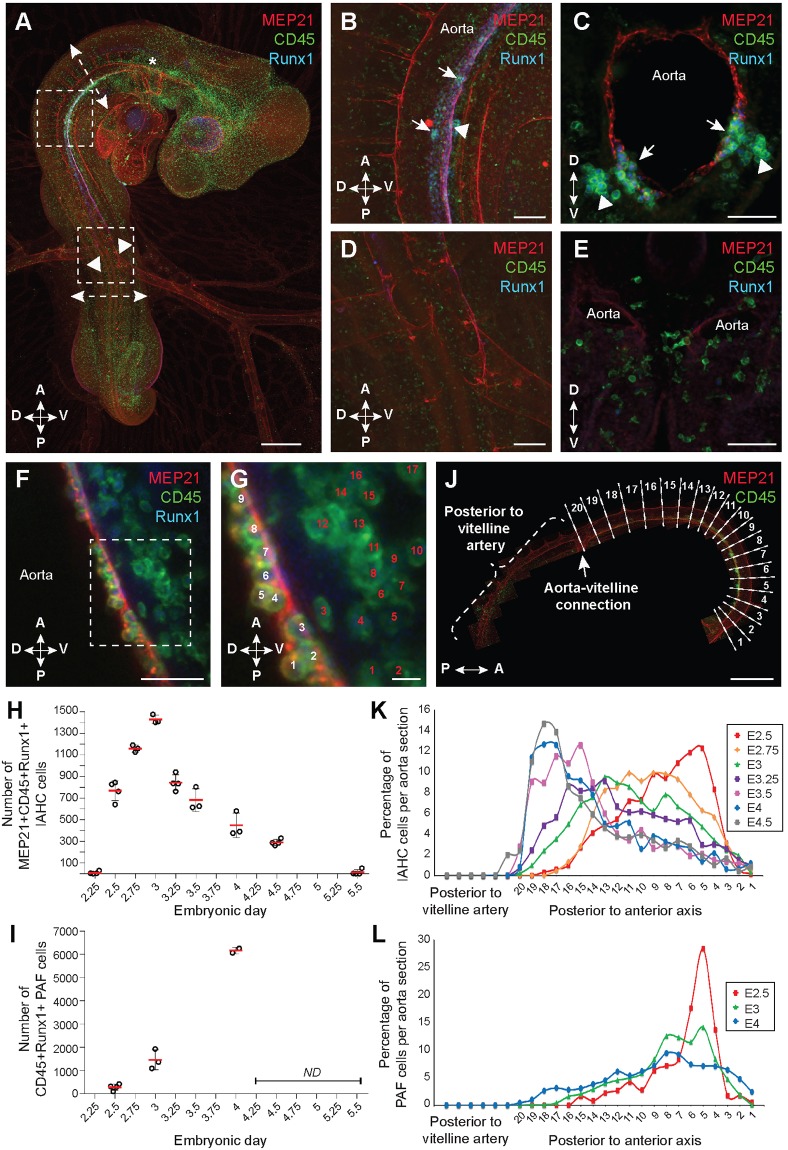
Fig. 1.
Spatial and temporal emergence of IAHC and PAF cells in the chicken embryonic aorta. (A) Whole-mount of E3 chicken embryo stained using anti-MEP21 (red), anti-Runx1 (blue) and anti-CD45 (green) antibodies. Asterisk, aortic arches; arrowheads, aorta-vitelline connection; upper boxed area is enlarged in B; lower boxed area is enlarged in D; upper and lower dashed arrows indicate the locations of the cross-sections shown in C and E, respectively. (B,C) Enlarged views of the anterior part of the aorta. Sagittal (B) and transverse (C) views. (D,E) Enlarged views of the posterior part of the aorta. Sagittal (D) and transverse (E) views. The aorta is paired in the posterior region of the E3 embryo. Arrowheads, PAF cells; arrows, IAHC cells. (F) Enlarged view of the anterior part of an E3 chicken aorta stained using anti-MEP21 (red), anti-Runx1 (blue) and anti-CD45 (green) antibodies. (G) Enlarged view of the anterior part of the aorta boxed in F, illustrating the counting of MEP21+Runx1+CD45+ IAHC (white numbers) and Runx1+CD45+ PAF (red numbers) cells. Images in A,B,D are related to Movie 1. (H) The total number of MEP21+Runx1+CD45+ IAHC cells per aorta between embryonic day (E)2.25 and E5.5. (I) The total number of Runx1+CD45+ PAF cells per aorta at E2.5, E3 and E4. (J) Maximal projection of the aorta stained using anti-MEP21 (red) and anti-CD45 (green) antibodies. The inter-somitic vessel (ISV) position is used to virtually subdivide the aorta into sections (along the anterior to posterior axis, 1 to 20 sections). (K) Percentage of MEP21+Runx1+CD45+ IAHC cells per aorta section between E2.5 and E4.5. (L) Percentage of Runx1+CD45+ PAF cells per aorta section at E2.5, E3 and E4. Scale bars: 500 µm in A,J; 100 µm in B,D; 50 µm in C,E,F; 10 µm in G. A, anterior; P, posterior; D, dorsal; V, ventral.

