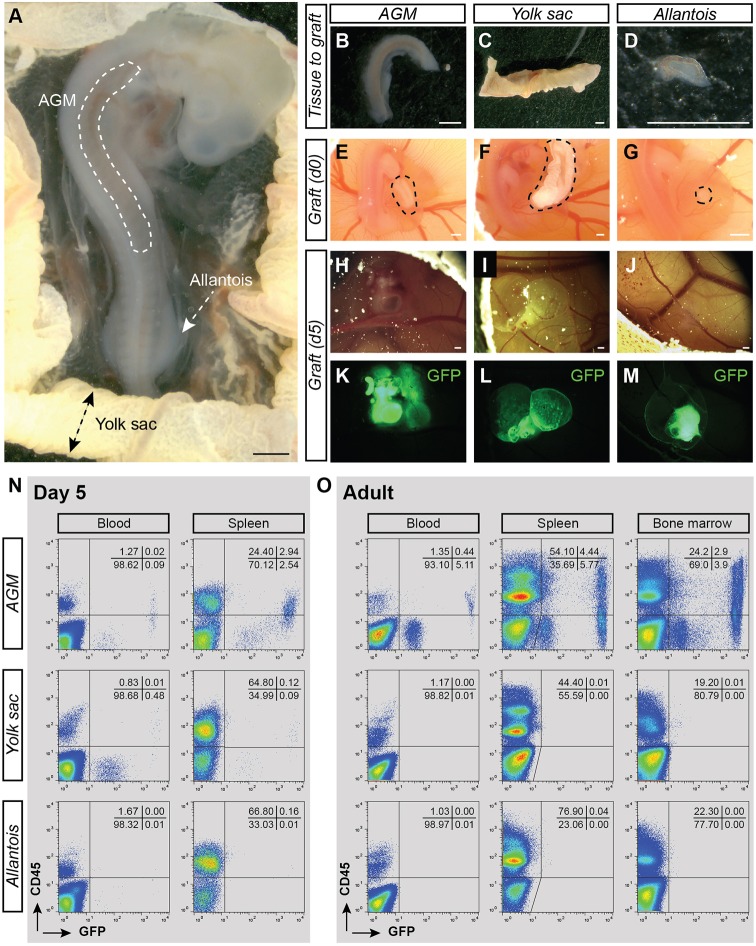
Fig. 2.
CAM transplantations allow the autonomous development of dissected AGM, yolk sac and allantois from E3 chicken embryos. (A) Transmitted light picture of E3 GFP+ chicken embryo. The locations of the AGM region, yolk sac (YS) and allantois are indicated. (B-D) Transmitted light pictures of the AGM (B), YS (C) and allantois (D) after dissection. (E-G) Transmitted light pictures of the AGM (E), YS (F) and allantois (G) shown in B-D after transplantation in the CAM of an E4 recipient embryos (in ovo views). Dashed areas indicate the position of grafted tissues. (H-J) Transmitted light pictures of the AGM (H), YS (I) and allantois (J) CAM at 5 days post-transplantation. (K-M) Fluorescent pictures of the AGM (K), YS (L) and allantois (M) CAM shown in H-J. GFP, green. (N) Flow cytometry analysis showing donor-cell contribution (GFP) in blood and spleen of AGM (top plots), YS (middle) and allantois (bottom) CAM recipients at 5 days post-transplantation. Cells were stained with anti-CD45 antibody (donor hematopoietic cells: GFP+CD45+). Percentages of each viable population are indicated per quadrant. (O) Flow cytometry analysis showing donor-cell contribution (GFP) in blood, spleen and BM of AGM (top plots), YS (middle) and allantois (bottom) CAM recipients at 5 months post-transplantation. Cells were stained with anti-CD45 antibody (donor hematopoietic cells: GFP+CD45+). The analyzed tissue CAM recipients are shown in Table 2. Scale bars: 500 µm.

