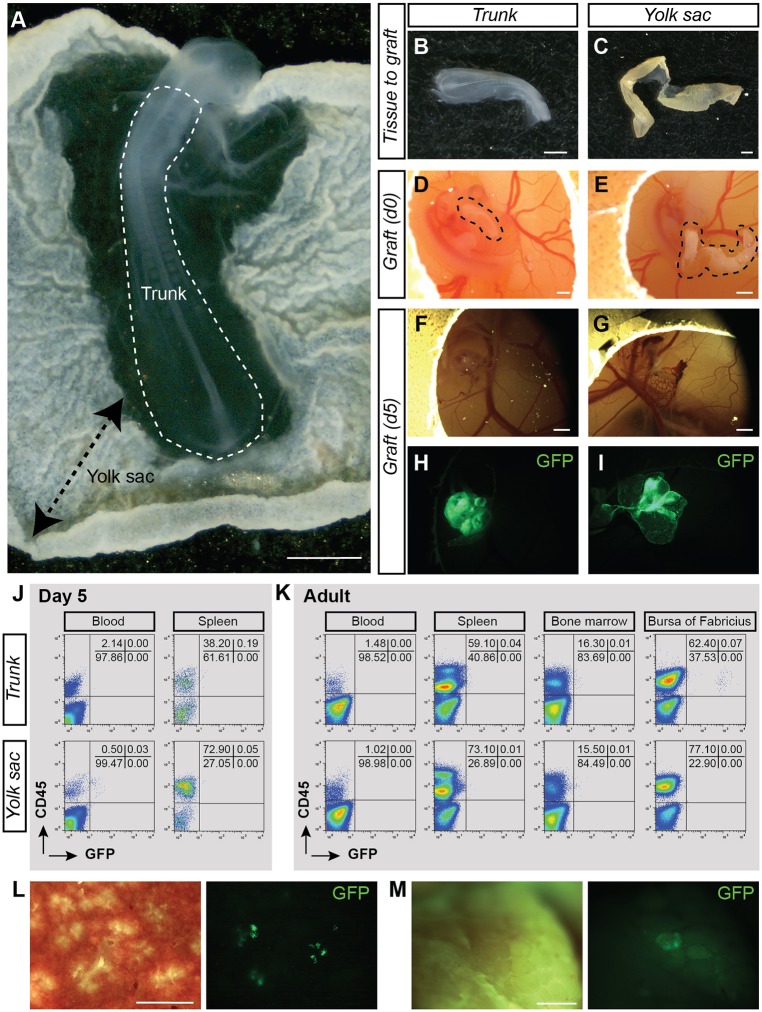
Fig. 5.
Long-term B-lymphoid biased potential in E2 embryo. (A) Transmitted light picture of an E2 GFP+ chicken embryo. Trunk and yolk sac (YS) locations are indicated. (B,C) Transmitted light pictures of the trunk (B) and YS (C) after dissection. (D,E) Transmitted light pictures of the trunk (D) and YS (E) (shown in B and C) after transplantation in the CAM of E4 recipient embryos. Dashed areas indicate grafted tissues. (F,G) Transmitted light pictures of the trunk (F) and YS (G) CAM at 5 days post-transplantation. (H,I) Fluorescent (GFP) pictures of the trunk (H) and YS (I) CAM shown in F,G. (J) Flow cytometry analysis showing donor-cell contribution (GFP) in blood and spleen of trunk (top plots) and YS (bottom plots) CAM recipients at 5 days post-transplantation. Cells were stained with anti-CD45 (hematopoietic cells) antibody. (K) Flow cytometry analysis showing donor-cell contribution (GFP) in blood, spleen, bone marrow and bursa of Fabricius of trunk (top plots) and YS (bottom plots) CAM recipients at 5 months post-transplantation. Cells were stained with anti-CD45 (hematopoietic cells) antibody. The analyzed tissue CAM recipient is shown in Table 2. (L) Enlarged view of a transverse section of the spleen isolated from an adult trunk CAM recipient [transmitted light, left panel; fluorescence (GFP), right panel]. (M) Enlarged view of the bursa of Fabricius isolated from an adult trunk CAM recipient [transmitted light, left panel; fluorescence (GFP), right panel]. Scale bars: 1 mm.

