Fig. 1.
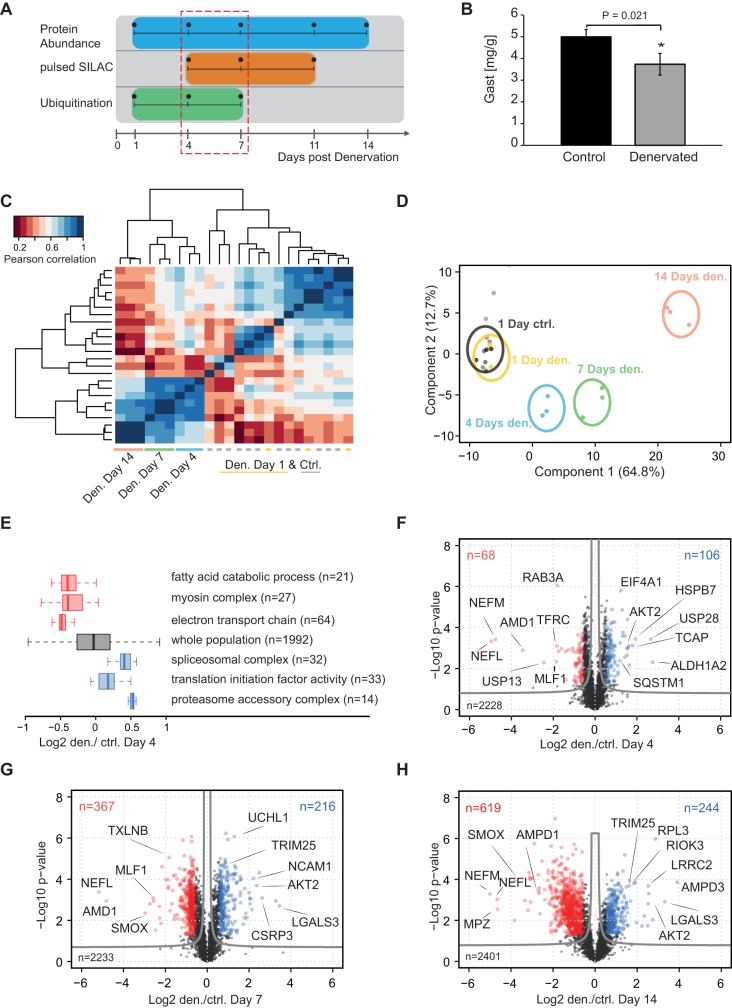
Denervation-induced muscle atrophy in the mouse gastrocnemius muscle. (A) Overview of the sciatic nerve section model. (B) Weight of the mouse gastrocnemius muscle (GAST, n=3) at 7 days after denervation. (C) Pearson correlation matrix of protein expression levels for all tested time points after denervation (biological triplicates). The heatmap based on Euclidean distance for the correlation matrix shows grouping of the control and denervated muscles. The correlation is based on log2 heavy/light (H/L) ratios shown in Table S1. (D) Principal component analysis protein levels showing clear separation of control and denervated muscle samples. (E) One-dimensional enrichment of GO terms at 4 days after denervation. Boxplots represent the log2 direct ratio distribution of proteins annotated with specific GO terms. (F-H) Volcano plots for day 4, 7 and 14, with correction for multiple testing by a randomization-based FDR calculation using a cut-off of 0.05 (fudge factor S0=0.1).

