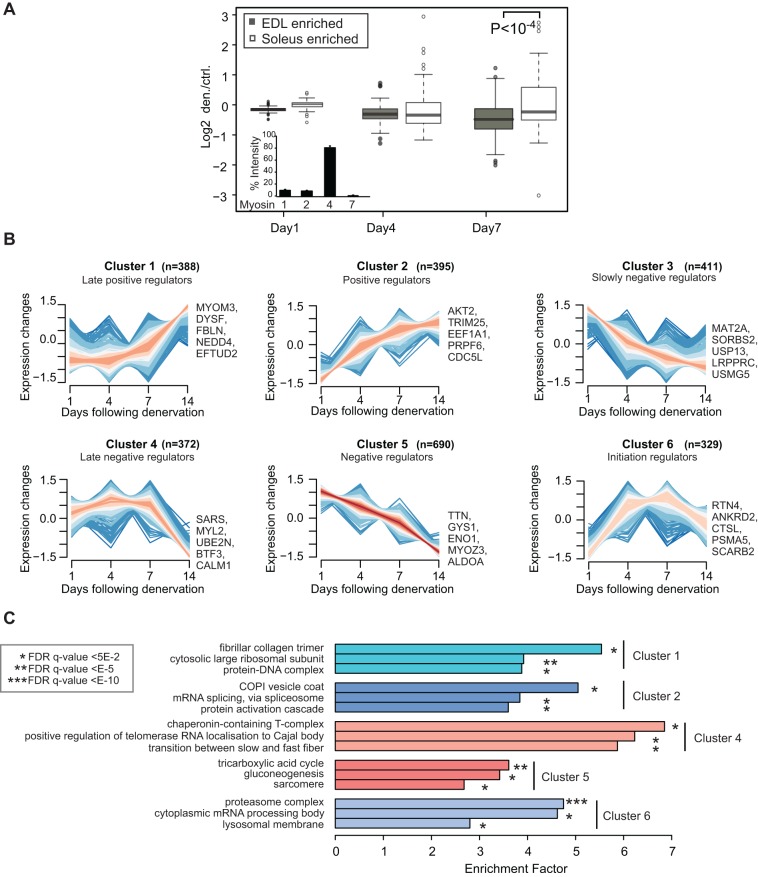
Fig. 2.
Systematic characterization of protein expression changes during muscle atrophy. (A) Overlap of protein expression data with soleus ‘slow’ and EDL ‘fast’ marker proteins. The boxplot analysis shows the comparison of EDL and soleus marker proteins between days 1 and 7. Inset: label-free quantification of myosin-1 (MYHC IIx), myosin-2 (MYHC IIa), myosin-4 (MYHC IIb) and myosin-7 (MYHC I). (B) Z-score normalized ratios were subjected to soft clustering with the mfuzz software tool. Six clusters represent different expression profiles upon denervation. (C) GO-term enrichment for clusters 1-5.

