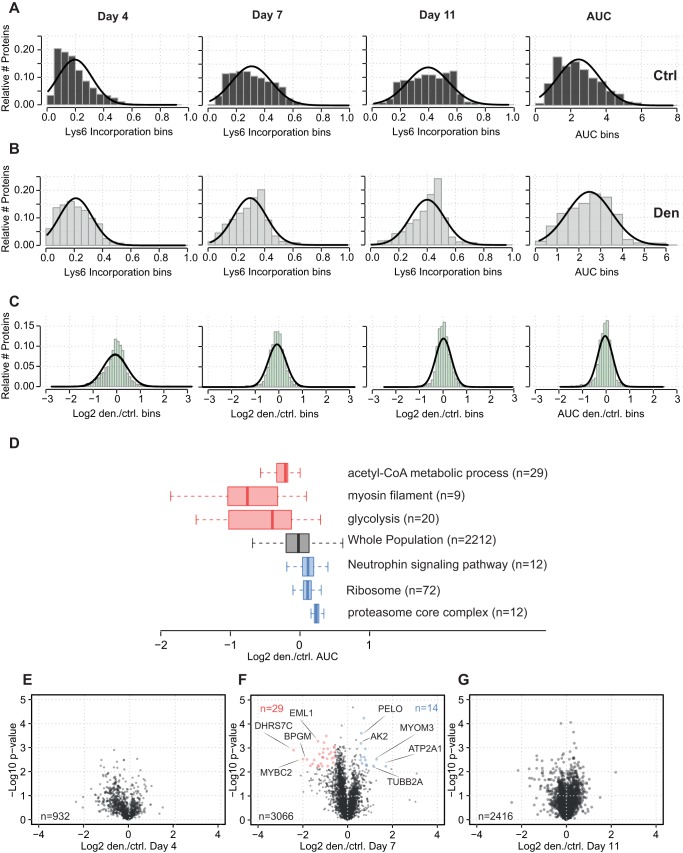
Fig. 5.
Pulsed SILAC analysis of protein synthesis during atrophy. (A) Relative Lys6 incorporation for control muscle over time. The percentage labelling was calculated as (H/L)/(H/L+1). The right panel in A shows the AUC for all time points. (B) Relative Lys6 incorporation for denervated muscle over time. (C) Ratio of Lys6 incorporation in control and denervated muscles. Log2 transformation ratios indicated a normal distribution. (D) One-dimensional enrichment and boxplot analysis show reduced Lys6 labelling of GO terms containing metabolic and myosin filament proteins (red boxes). Proteasomal proteins (blue boxes) exhibited increased Lys6 labelling. (E-G) Volcano plots of Lys6 incorporation in denervated and control muscles. One-sample t-test showing that significantly regulated proteins were observed only on day 7 (q<0.05). Day 4 samples were analysed as biological duplicates and day 7-11 as biological triplicates.

