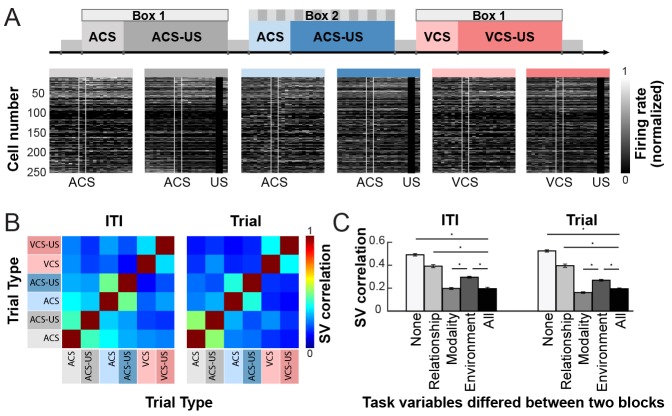
Figure 6. Ensemble activity showed a comparable level of selectivity for stimulus-environment conjunction during stimulus and non-stimulus periods.
(A) Grayscale plots show the normalized firing rate during six trial blocks (from left, ACS trials in Box 1, ACS-US trials in Box 1, ACS trials in Box 2, ACS-US trials in Box 2, VCS trials in Box 1, and VCS-US trials in Box 1). Cells were sorted based on the ACS-induced firing rate during the ACS-US block in Box 1, from the largest increase (cell #1) to the largest decrease (cell #250). Two white lines indicate the onset and offset of the CS while black bars mask US artifacts. (B) Matrices of the correlation coefficient (r) of ensemble firing rates (State vector, SV) between two of six trial blocks during CS-US pairings (Trial) and intervals between trials (ITI). (C) During both task phases, the r for two blocks with different CS (Modality; mean ± SEM, n = 20 runs with 10 subsampled trials) was comparable to that for two blocks that differed in all task variables (All). It was significantly lower than that in different conditioning boxes (Environment) and with different stimulus contingencies (CS-alone blocks and CS-US blocks, Relationship). The r for Relationship was significantly higher than that for Environment but lower than that for odd- and even-numbered trials from the same block (None). *p<0.001, in posthoc Tukey HSD.
DOI: http://dx.doi.org/10.7554/eLife.28611.013
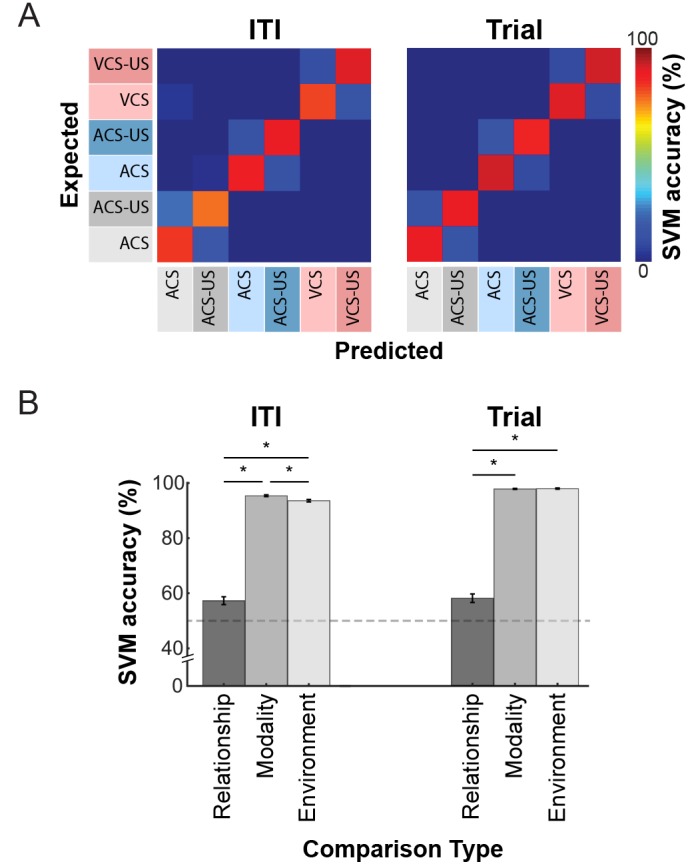
Figure 6—figure supplement 1. Ensemble firing patterns differentiated trial blocks more strongly depending on the CS modality and conditioning environment than CS-US relationship.


