. 2017 Jul 31;6:e26404. doi: 10.7554/eLife.26404

Figure 1. REMORIN localization into highly ordered PM nanodomains is mediated by sterols and PI4P.

( A ) Explanatory schematic of the secant or surface views of N. benthamiana leaf abaxial epidermal cell plasma membrane ( PM ) used throughout the article. ( B ) Confocal imaging surface views of Nicotinana benthamiana leaf epidermal cells expressing YFP- St REM1.3 with or without dominant-negative SAR1 H52N (PMA4-GFP was used as a potency control, see Figure 1—figure supplement 2 ), 24 hr after agroinfiltration. Tukey boxplots show the mean fluorescence intensity and the Spatial Clustering Index , SCI ( n = 3, quantification made on a representative experiment, at least 38 cells per condition). ( C ) Surface view confocal images showing the effect of Fenpropimorph (Fen) on PM patterning of YFP- St REM1.3 domains 20 hr after agroinfiltration. Tukey boxplots show the mean fluorescence intensity and the SCI of YFP- St REM1.3 in the Mock ( DMSO ) or Fen-treated leaves ( 50 µg / mL ), at least 46 cells from three independent experiments. ( D ) Secant view confocal fluorescence microscopy images displaying the degree of order of CFP- StREM1.3 ‐ enriched domains (left panel) by the environment ‐ sensitive probe Di ‐ 4 ‐ ANEPPDHQ (middle panel) 48 hr after agroinfiltration. Di ‐ 4 ‐ ANEPPDHQ red / green ratio ( RGM ) was measured for the global PM, and for the 10, 5, 2 % most intense CFP- St REM1.3 signal-associated pixels (right panel). A lower red / green ratio is associated with an increase in the global level of membrane order, at least 70 cells from three independent experiments. ( E ) Surface view confocal images showing the effect of dead or active constructs of MAP-SAC1p (MAP-mTurquoise2-SAC1p from yeast, see Figure 1—figure supplement 5 ) on PM domain localization of YFP- St REM1.3 20 hr after agroinfiltration. Tukey boxplots show the mean fluorescence intensity and the SCI of YFP- St REM1.3, at least 52 cells from four independent experiments. ( F ) Model showing the PI4P-driven targeting of the trimer of St REM1.3 to the PM and its PI4P- and sterol-dependent nanodomains organization. In all panels, p - values ​​were determined by a two-tailed Mann-Whitney test.

Figure 1.

Figure 1—figure supplement 1. Sequence alignment of 51 group 1 REMORIN C-terminal Anchor sequences.

Figure 1—figure supplement 1.

Figure 1—figure supplement 2. Nicotiana benthamiana Group 1b REMORINs are expressed in leaf epidermal cells, encode for PM nanodomain localized proteins and are functional homologs of StREM1.3 toward PVX propagation.

Figure 1—figure supplement 2.

( A ) REMORIN genes of N. benthamiana expressed in Reads Per Kilobase of transcripts per million mapped reads ( RPKM ). RNAseq data were retrieved using SRA toolkit (see experimental section). ( B ) Pairwise comparison of protein identity for St REM1.3 and closest group 1 Nb REMs expressed as a percentage of identity. ( C ) Photo of epidermis peeling performed on a glass slide freezing with liquid nitrogen to reduce transcriptional modification due to mechanical stress. Leaf tissue (1) without skin (2) and epidermis (3). ( D ) The expression of endogenous Nb REM1.3 and NbREM1.2 in epidermis was revealed by RT-PCR. ( E, F ) Confocal microscopy pictures of transiently expressed RFP- Nb REM1.2 and GFP- Nb REM1.3 transiently-expressed via A. tumefaciens in N. benthamiana epidermal cells at 2 DAI show that they both localize in PM-nanodomains. Scale bar indicate 10 μm . ( G ) Propagation of PVX :: GFP alone and in combination with A. tumefaciens carrying empty vector (mock), RFP- St REM1.3, RFP- Nb REM1.2 or RFP- Nb REM1.3, and corresponding quantification. Scale bar indicate 400 μm .n = 4 . Letters indicate significant differences revealed by Tukey's comparisons test p < 0.001 . ( H ) Total proteins extracted from leaf samples and probed by anti-StREM1.3 antibodies.
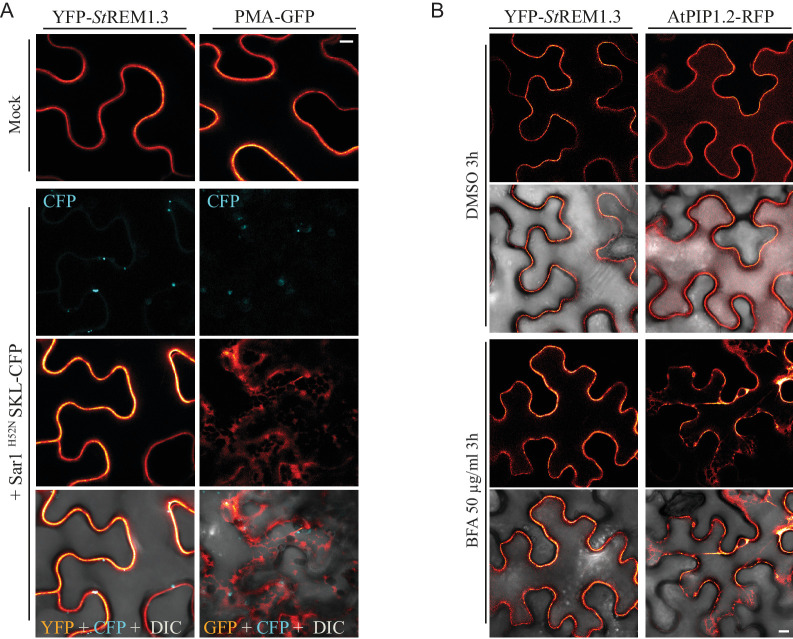
Figure 1—figure supplement 3. YFP- St REM1.3 is targeted to the PM-domains by a mechanism independent of the COP-I / COP-II secretory pathway.

Figure 1—figure supplement 3.

( A ) Secant view of confocal dual-color imaging of N. benthamiana expressing YFP- St REM1.3 or proton pump PMA4-GFP (used as positive control) with or without dominant-negative Sar1 H52N / SKL-CFP 24 hr after agro -infiltration, SKL-CFP is used as a transformation control ( de Marcos Lousa et al., 2016 ). DIC: differential interface contrast. Scale: 10 µm . Lower pictures show merged images. ( B ) Secant view of confocal images of N. benthamiana expressing YFP- St REM1.3 or aquaporin At PIP1.1-RFP with or without Brefeldin A, 48 hr after agroinfiltration. Scale bar: 10 µm .
Figure 1—figure supplement 4. Spatial clustering index calculated as the max-to-min ratio of fluorescence intensity in the PM.

Figure 1—figure supplement 4.

( A, B ). Surface view confocal images of N. benthamiana epidermal cells expressing YFP- St REM1.3 or PMA4-GFP 48 hr after agroinfiltration. ( C ) Fluorescence Intensity plots through the indicated lines. ( D ) Spatial Clustering Index ( SCI ) was calculated by dividing the mean of the 5 % highest values ​​by the mean of 5 % lowest fluorescence intensities values ​​(UA) in the PM. Comparison of SCI show the difference of clustering between PMA4 (smooth location, n = 27 cells ) andSt REM1.3 (discrete location, n = 22 cells ), significance tested by a two-tailed Mann-Whitney test. E, FG ) SCI is not correlated with fluorescence intensity. Surface view confocal images and intensity plots along the indicated lines of N. benthamiana epidermal cells expressing low or high levels of YFP- St REM1.3. ( H ) Tukey boxplot showing statistical differences in fluorescence intensity of cells expressing low or high levels of YFP- St REM1.3, n = 17 . ( I ) SCI calculated for cells expressing low or high fluorescence levels of YFP- StREM1.3 showing no difference in YFP- St REM1.3-associated nanodomains in the PM between the two levels of expression. Different italicized-letters indicate significant differences among means ( p < 0.001 , two-tailed Mann-Whitney test).
Figure 1—figure supplement 5. Modification of the sterol pool of N. benthamiana leaves by the drug Fenproprimorph (fen).

Figure 1—figure supplement 5.

( A ) Quantification by GC-MS of the Δ5 phytosterols and cycloartenol from control and fen-treated N. benthamiana leaves ( n = 3 , error bars indicate SEM). Cycloartenol accumulation is similar to what was decribed in ( Grison et al., 2015 ). ( B ) Confocal images of surface or secant views of control and fen-treated N. benthamiana leaf epidermal cells expressing PMA4-GFP 48 hr after agroinfiltration. ( C – E ) Intensity plots and SCI of PMA4-GFP after fen treatment. Scale bars, 10 µm .
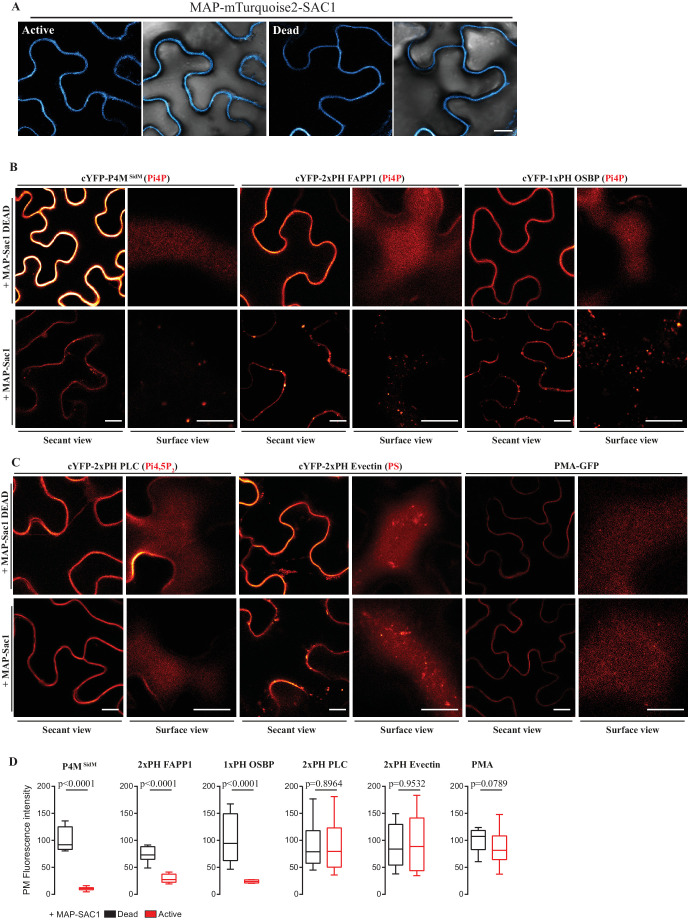
Figure 1—figure supplement 6. Myristoylation and Palmitoylation ( MAP ) -mTurquoise2-SAC1p localizes at PM of N. benthamiana leaf epidermal cells and specifically depletes PM PI4P but not PI (4,5) P 2 or PS.

Figure 1—figure supplement 6.

( A ) Secant view confocal images of N. benthamiana leaf epidermal cells expressing either Dead or Active MAP-mTURQUOISE2-SAC1p from yeast constructs and P19 to increase expression ( Baulcombe and Molnár, 2004 ). Observations were made 48 hr after agroinfiltration. Scale bar, 10 µm . ( B ) Secant view confocal images of N. benthamiana leaf epidermal cells expressing three independent PI4P binding domain biosensors: cYFP-P4M SidM , mCitrine-2xPH (FAPP1) and mCitrine-1xPH (OSBP1) ( Simon et al., 2014 ) alone or co-expressed with either active or dead MAP-mTurquoise2-SAC1p (Simon et al., 2016 ). ( C ) Secant and surface view confocal images of N. benthamiana leaf epidermal cells expressing a sensor for PIP4,5P 2 (cYFP-2xPH PLC), a sensor for PS (cYFP-2xPH Evectin) and the PM protein (PMA4-GFP) with either active or dead MAP-mTurquoise2-SAC1p. Scale bars for secant and surface views, 10 µm . ( D ) Quantification of PM fluorescence intensity for Pi4P, PS, PI (4,5) P 2 biosensors and PMA4-GFP under co-expression with MAP-SAC1p and MAP-SAC1p dead.