. 2017 Jul 19;6:e20705. doi: 10.7554/eLife.20705

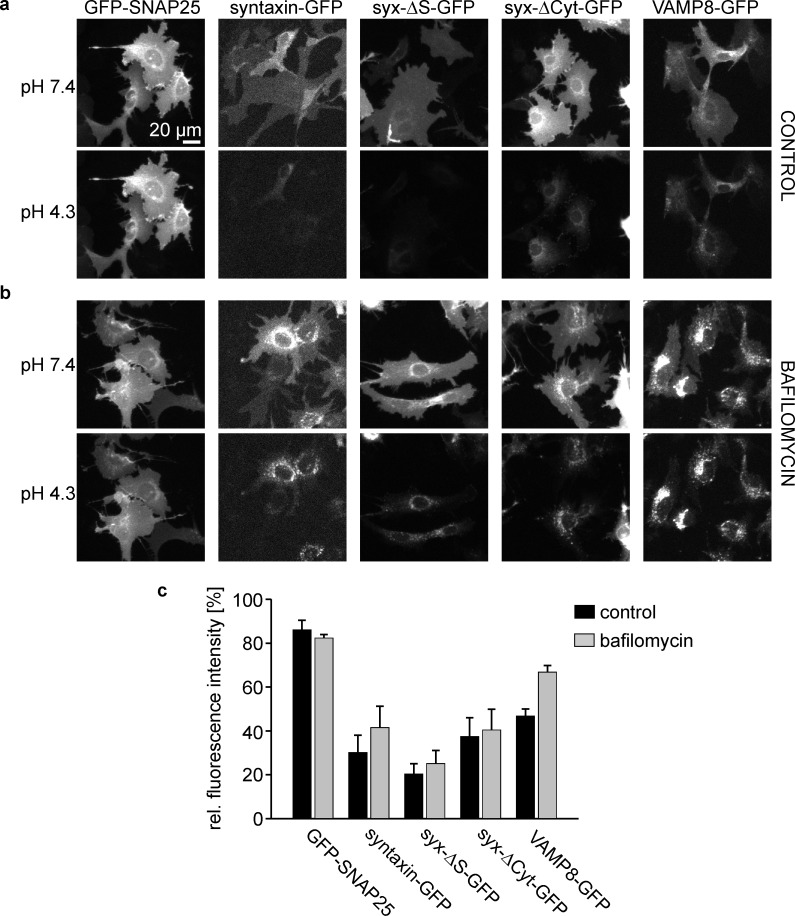
Figure 2. Plasma membrane targeting of the different syntaxin variants.

HepG2 cells expressing GFP-labelled SNAP25, syntaxin, syx-ΔS, syx-ΔCyt, or VAMP8 were incubated at 37°C for 45 min (a) without or (b) with 0.2 µM bafilomycin. The GFP-signal was imaged at pH7.4, followed by another image taken at pH4.3. Images in one column are shown at the same scaling. (c) Remaining cell fluorescence upon acidification is expressed in percent. Values are given as means ± S.E.M. (n = 3 independent experiments; for one experiment values from 16 to 38 cells per construct and condition were averaged).

DOI: http://dx.doi.org/10.7554/eLife.20705.003

Figure 2.

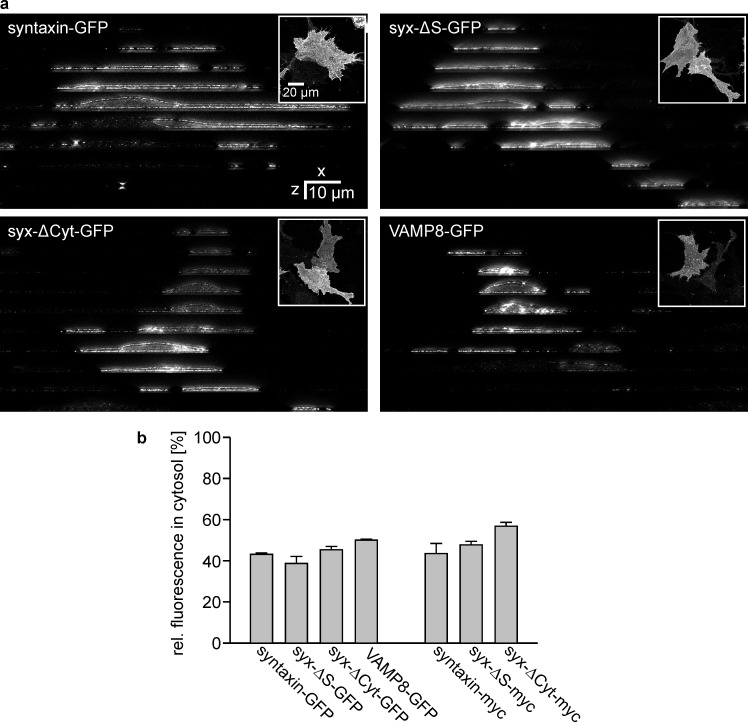
Figure 2—figure supplement 1. Subcellular distribution analysis by STED microscopy.

Figure 2—figure supplement 1.

Cells expressing either syntaxin-GFP, syx-ΔS-GFP, syx-ΔCyt-GFP, VAMP8-GFP, syntaxin-myc, syx-ΔS-myc or syx-ΔCyt-myc were fixed and permeabilised prior to immunostaining with an antibody raised against the respective tag. The plasma membrane was counterstained with fluorescent labelled concanavalin A (not shown). (a) Images from the GFP-labelled constructs. The upper right insets show an x-y overview. Using this overview as reference an x-z slice was imaged every 10 µm (with reference to these overview images from top to bottom; the individual x-z-slices are shown as image collage) by two colour STED microscopy imaging concanavalin A (Alexa594) and the antibody labelling (Atto647). (b) Fraction of the intracellular signal. Values are given as means ± SEM (n = 2–3 independent experiments with 7–26 cells per condition).