
Extended Data Figure 1. Strategy for 6-colour labelling, image acquisition and analysis (confocal).
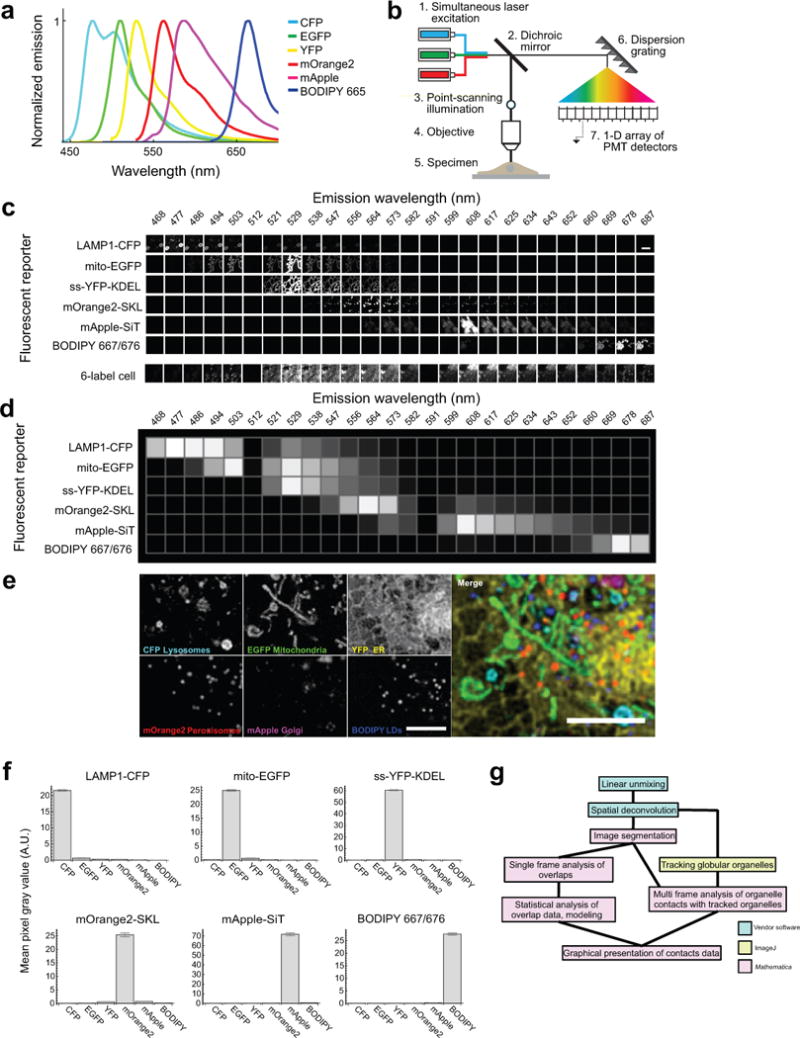
Fluorescence spectral imaging has emerged as a technology that allows many different spectrally variant fluorescent markers to be distinguished in a single sample31. The most widely used approach for computational analysis of spectral images, called linear unmixing (LU), involves a matrix inverse operation to find the best fit of known fluorophore spectra to that of the recorded spectrum at every pixel in a digital image9. Although this and other multispectral approaches have been used in commercial instruments to distinguish multiple combinations of organic dyes in fixed microbes32,33 and fixed neuronal tissue34, its application to multi-labelled cells and their quantitative analysis remains underdeveloped in live cell experiments. (a) Published emission spectra for the fluorophores used in confocal experiments: CFP35, EGFP35, YFP35, mOrange235, mApple36 and BODIPY 665/67637. (b) Schematic of the hardware used for 6-colour confocal microscopy. The specimen was excited using three lasers simultaneously, by point-scanning illumination. Emitted light was collected by a linear array of detector elements after being dispersed by a reflective dispersion grating. (c) To derive the values for the known fluorophore matrix, images of singly labelled cells were acquired at each wavelength and under the same acquisition conditions used to acquire images of 6-label cells. Intensity values centred at 512 nm and 591 nm were zero for all cells because these detector elements were blocked to prevent scattered laser excitation light from reaching the detector. (d) Graphical representation of the unmixing matrix. The normalized intensity values at each wavelength range from 0 to 1. (e) Zoom-up of a region of the cell shown in Fig. 1a. Scale bars, 5 μm. Micrographs are representative of 10 cells captured. (f) Plots of mean pixel intensity values for all 6 fluorophores in every pixel in singly labelled cells that were segmented as foreground. Cells were singly labelled with LAMP1-CFP, mito-EGFP, ss-YFP-KDEL, mOrange2-SKL, mApple-SiT, or BODIPY 665/676. n = 87,307 pixels from one cell (CFP), 5,933 pixels from one cell (EGFP), 84,127 pixels from one cell (YFP), 2,711 pixels from one cell (mOrange2), 11,804 pixels from one cell (mApple), 3,332 pixels from one cell (BODIPY 667/676). Error bars represent s.e.m. A.U. = Arbitrary Units. (g) Imaging-informatics pipeline for quantitative analysis of organelle contacts. 32-channel micrographs of samples were subjected to pixel-based LU and spatial deconvolution algorithms, resulting in 6-channel unmixed images. These images were segmented to generate features, and contacts between features (within 1 pixel, 97 nm) were analysed in single frames. Alternatively, globular organelles were tracked and their contacts with segmented features analysed over multiple frames. The pipeline is modular and involves five major components: pixel-based LU of raw image data; spatial deconvolution; segmentation of organelles to generate features; particle tracking of globular organelles over time; and integration of track data with segmented image data to identify organelle contacts between the labelled organelles. The first four modules are implemented in existing software packages, either commercially available (Zeiss Zen and Huygens software) or freely available (histogram based segmentation algorithms and TrackMate plugin in ImageJ for particle tracking)38,39. For the final component of the pipeline we developed an image analysis program on the Mathematica platform (available for downloading at http://organelle-interactome.sourceforge.net) that identifies feature-based colocalization.