
Figure 3. Live-cell, 6-colour 4D LLS microscopy to characterize organelle distribution in space and time.
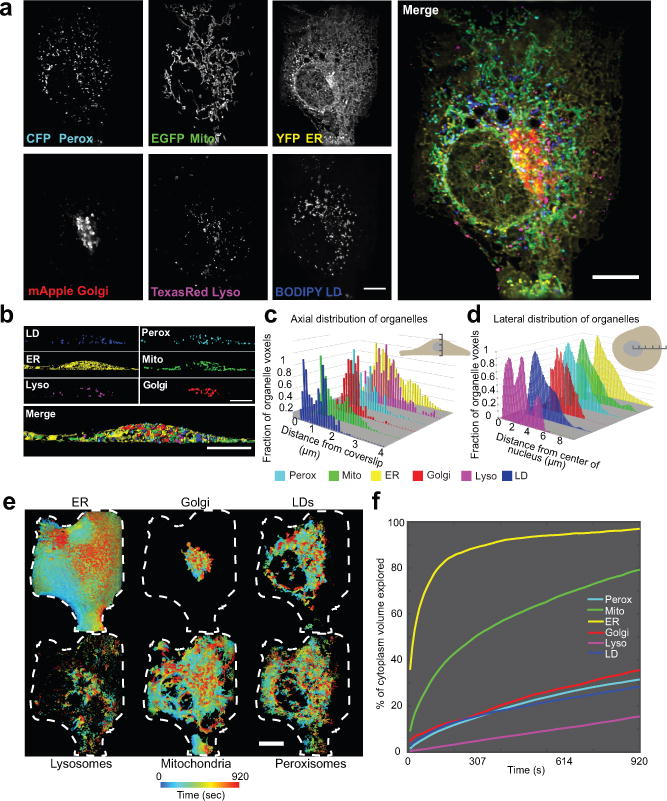
(a) Maximum intensity projections of a COS-7 cell expressing CFP-SKL, mito-EGFP, ss-YFP-KDEL, and mApple-SiT, and labelled with Texas Red dextran and BODIPY 665/676. (b) XZ images of segmented LLS images. (c-d) Distributions of organelles in the axial (c) and lateral (d) dimensions of a single COS-7 cell, representative of 10 cells captured. (e) Organelle dispersion in the cell over time. Voxels are colour coded according to the time that an organelle last occupied that voxel. Shown are 2-D projections where only the outer shell of the volume is visible. Cell was masked using the total dispersion of the ER as a proxy for the cell boundary. Dashed white lines represent the 2-D projected outline of the cell generated from the mask. See Video 5 to explore the volume in depth. (f) Dispersion analysis. The summed fractional cytoplasmic volume (excluding the nucleus) occupied by each organelle is plotted as a function of time. Scale bars, (a, e) 10 μm, (b) 5 μm. Micrographs are representative of 10 cells.