
Extended Data Figure 4. Validation of 6-colour labelling and organelle interaction measurements (confocal).
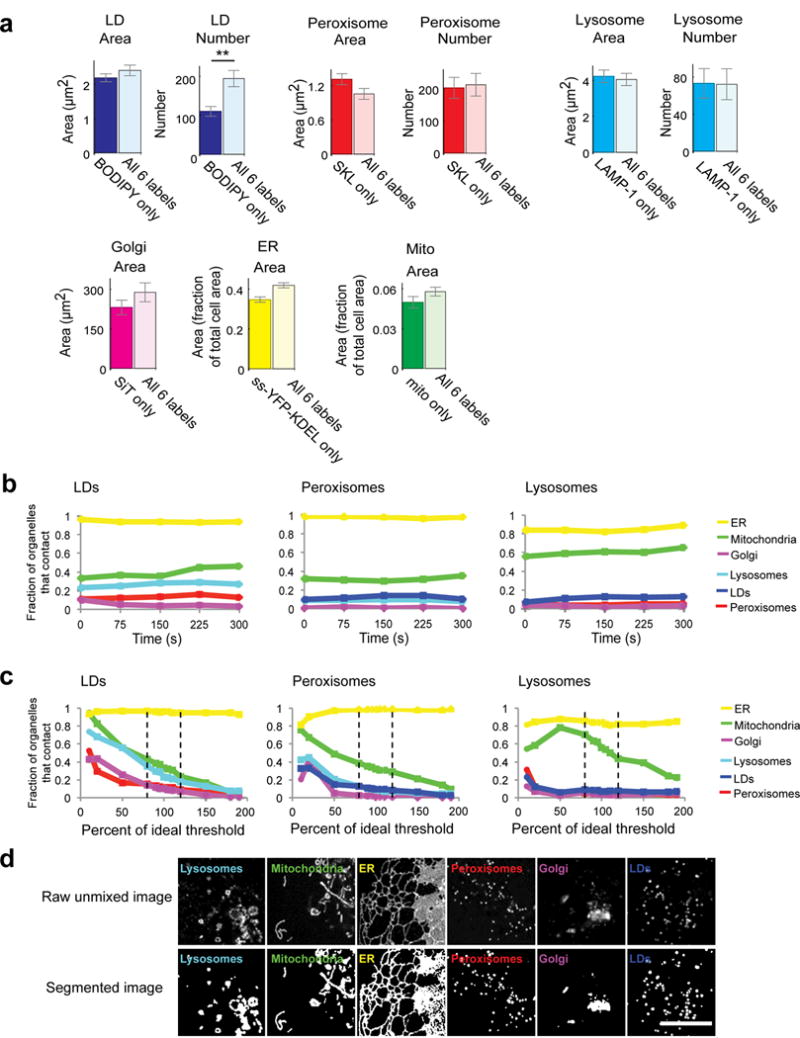
(a) To test the effect of co-expressing all six labels on organelle properties, we compared the number and/or area of organelles in cells singly transfected with one organelle marker or incubated with BODIPY, with cells labelled with all six organelle markers. For LDs, peroxisomes, and lysosomes, mean cross-sectional area and number were measured. For Golgi, total cross-sectional area/cell was measured. For ER and mitochondria, the fraction of cell area occupied by these organelles was measured. Only LD number showed a significant difference between singly- vs. multiply-labelled conditions. n = 20 cells for all 6 labelled cells, n = 20 cells (BODIPY only), n = 14 cells (SKL only), n = 21 cells (LAMP-1 only), n = 19 cells (SiT only), n = 18 cells (ER only), n = 20 cells (mito only). ** p < 0.01 (unpaired, two-tailed t-test). Bar heights represent mean values and error bars represent s.e.m. (b) Line graphs showing the fraction of LDs, peroxisomes or lysosomes contacting each of the other labelled organelles in one cell over time, measured discreetly at 0, 75, 150, 225 and 300 s. The fraction of total LDs, peroxisomes or lysosomes contacting each of the other organelles remained constant over the course of imaging, consistent with minimal perturbation and phototoxicity during the imaging period. (c) Line graphs showing the fraction of LDs, peroxisomes or lysosomes contacting each of the other labelled organelles in one cell (cell 1 in Extended Data Fig. 3a) after modulating the threshold value for all channels by a fixed percentage. Dashed lines represent a threshold modulated up or down by 20%. Ideal threshold = 100%. For all organelles except mitochondria, modulating the threshold up or down by up to 20% from the algorithmically determined optimal threshold value did not significantly alter the measured number of organelle contacts, suggesting that our organelle contact measurements are insensitive to small differences in threshold parameters. (d) Examples of segmentation based on algorithmically-determined, optimal intensity threshold values. Micrographs are representative of 10 cells captured. Scale bar, 10 μm.