
Extended Data Figure 5. Effect of nocodazole on organelle contacts.
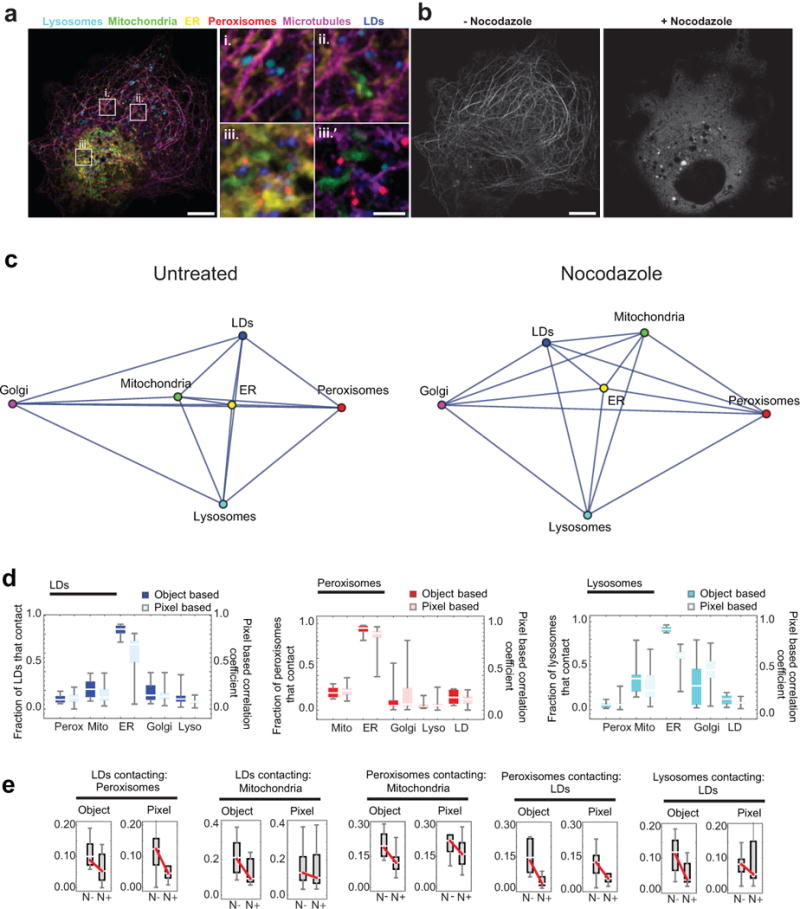
(a) Micrographs of a COS-7 cell labelled as in Fig. 1, except that instead of labelling Golgi, microtubules were labelled with mApple-MAP4-C10. i.-iii. Enlargements of the regions outlined in the left panel. iii.’ Region iii., without the ER displayed, for clarity. Lysosomes, mitochondria, the ER, peroxisomes, and LDs were all observed in close proximity to microtubules. Scale bars, 10 μm (left) and 2 μm (right). (b) The same cell as in (a), displaying only the microtubule channel, both before (left) and (after) treatment with 5 μM nocodazole for 1 h. Scale bar, 10 μm. Micrographs in (a) and (b) are representative of 20 cells captured. (c) Network diagrams of untreated and nocodazole-treated cells. Untreated network is the same as in Fig. 1d. After nocodazole treatment, the ER remains the central node in the network. (d) Comparison of object-based organelle contact analysis (bright) versus pixel-based organelle colocalization analysis (pastel). For the pixel-based analysis, a value of 1 indicates perfect co‐localization, while a value of 0 indicates the organelles are never co‐located. No statistical test was performed. (e) Comparison of the effect of nocodazole treatment on organelle contacts when images were analysed using either an object-based or pixel-based colocalization analysis scheme. Red lines connecting the median values indicate that the median number of contacts decreased after nocodazole treatment. Shown are all organelle contact pairs that showed a statistically significant change in contact frequency when cells were treated with nocodazole (unpaired, two-tailed t-test). (c-d) Object-based analysis data is the same as in Fig. 2a. n = 11 (nocodazole-treated) or n = 10 (untreated) cells from two experiments.