
Extended Data Figure 8. Validation of organelle interaction measurements (LLS).
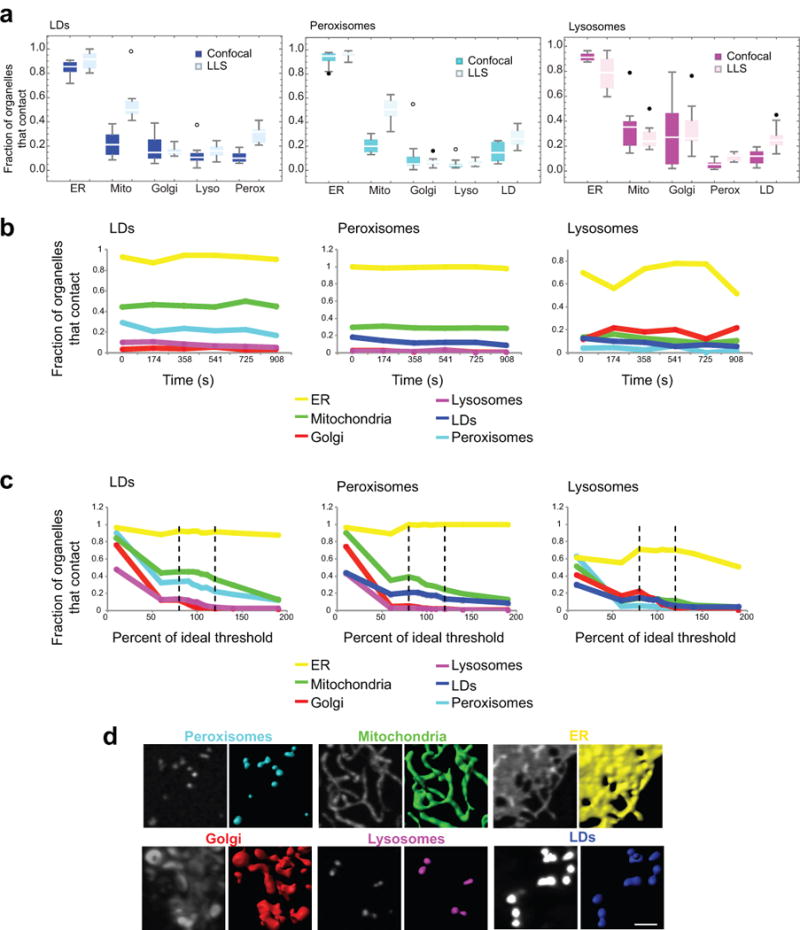
(a) Box whisker plots showing the median fraction of LDs, peroxisomes, or lysosomes making contact with each of the other labelled compartments in data obtained using confocal (bright) or LLS (pastel) microscopy. Confocal data is the same as in Fig. 2a. n = 10 cells (confocal), n = 10 cells (LLS). No statistical test was performed. The similarity in measurements from LLS and confocal images is likely because the globular organelles that we examined are smaller than the depth of focus of the confocal microscope, ensuring that all their inter-organelle interactions were detected even in the confocal images. (b) Line graphs showing the fraction of LDs, peroxisomes or lysosomes contacting each of the other labelled organelles in one cell measured over time at discreet points: 0, 174, 358, 541, 725 and 908 s. (c) Line graphs showing the fraction of LDs, peroxisomes or lysosomes contacting each of the other labelled organelles in one cell after modulating the threshold value for all channels by a fixed percentage. Dashed lines represent a threshold modulated by 20%. (d) Examples of segmentation performed using the ideal threshold (i.e., 100%) in (c). Scale bar, 2 μm. Micrographs are representative of 10 cells.