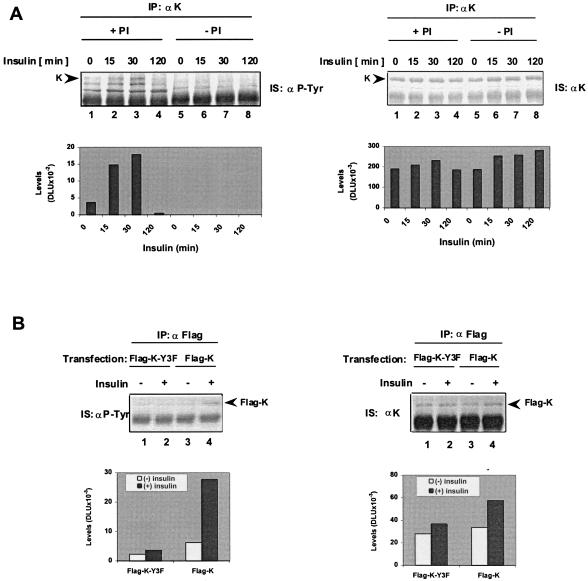
Figure 1.
Insulin treatment increases tyrosine phosphorylation of K protein in the hepatoma HTC-IR cells. (A) Serum-deprived HTC-IR cells (0.5% FCS for 24 hr) were treated with 2 × 10⁻⁹ M insulin (Humulin-N, Lilly Research Laboratories). At given times, cells were harvested, and whole-cell extracts were prepared with immunoprecipitated (IP) buffer (150 mM NaCl/5 mM EDTA/1% Triton X-100/0.5% Nonidet P-40/50 mM Tris⋅HCl, pH 7.5/10 μg/ml leupeptin/0.5 mM PMSF) with PIs (+PI) (0.5 mM DTT/30 mM p-nitrophenyl phosphate/10 mM NaF/0.1 mM Na3VO4/0.1 mM Na2MoO4/10 mM β-glycerolphosphate) or without PIs (−PI). Immunoprecipitated proteins from whole-cell lysates (200 μg) were resolved by SDS/PAGE, and after Western blotting, colorimetric immunostaining (IS) was done with either an anti-phosphotyrosine (Left, IS: αP-Tyr) or anti-K protein (Right, IS: αK) antibody. Blots were scanned with an Expression 638 scanner (Epson), and densitometric analysis of K protein bands (K) was done with OPTIQUANT image analysis software (Packard). Levels of band intensities after background subtraction are expressed in digital light units (DLU). (B) Serum-deprived HTC-IR cells were transiently transfected with SuperFect (Qiagen, Chatsworth, CA) (12) with Flag-tag expression plasmid containing either wild-type K protein Flag-K (lanes 3 and 4) or Flag-K-Y3F mutant (lanes 1 and 2). At 24 hr after transfection, cells were treated without insulin or with 2 × 10⁻⁹ M insulin for 30 min, and cell extracts were prepared in 1 ml of IP buffer +PI. Proteins were immunoprecipitated with anti-Flag monoclonal antibody (1 hr) and protein A beads (30 min). Beads were washed four times with 1 ml of IP buffer, and proteins were eluted by boiling in SDS-loading buffer. Eluted proteins were resolved on SDS/PAGE, and after electrotransfer, Western blotting was carried out by using anti-phosphotyrosine (Left) and anti-K protein antibody (Right). Blots were scanned, and densitometric analysis of the Flag-K protein band (Flag-K) intensities was done as described for A.

