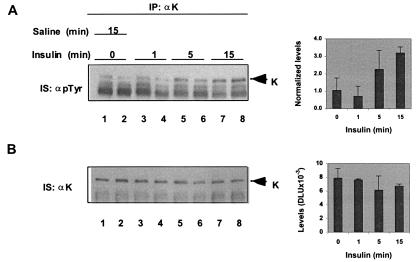
Figure 5.
Insulin injection modifies K protein in mouse livers. Portal veins of a group of two ether-anesthetized mice (20 gm each) were injected with 100 μl of either saline (15 min; lanes 1 and 2) or saline containing 20 mU insulin (Humulin N, Lilly Research Laboratories) (1, 5, and 15 min; lanes 3–8). At given times, livers were excised and frozen in liquid nitrogen (12). K protein immunoprecipitates (IP) were analyzed by SDS/PAGE and Western blotting. Band intensities were quantified by densitometric analysis as before. The tyrosine-phosphorylated K protein band levels were normalized by dividing the band intensities by the level of IgG heavy-chain signal. The data are expressed as means ± SD (n = 2 animals).

