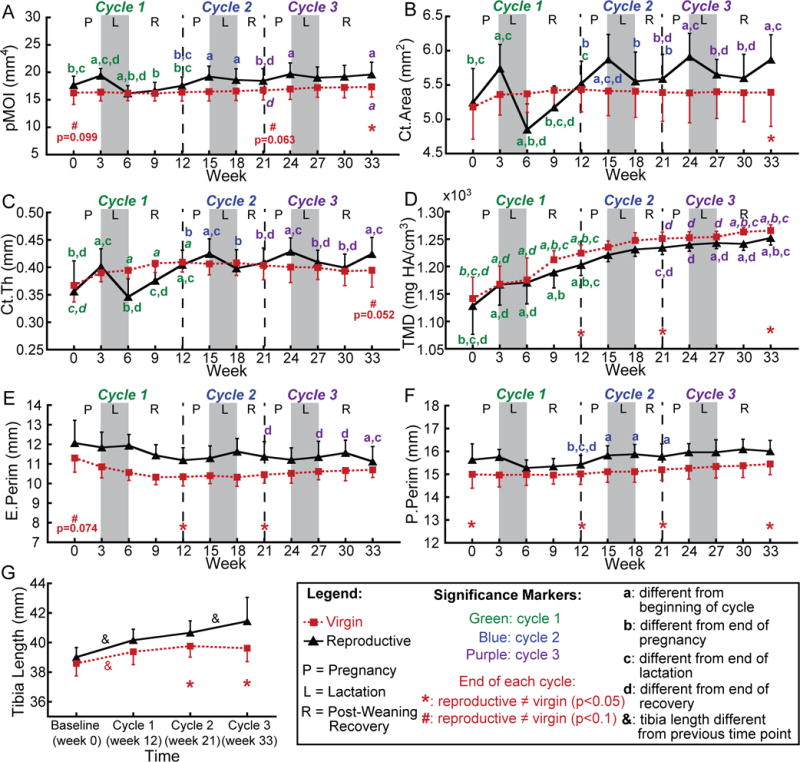
Figure 4.

(A–F) Changes in cortical bone structural parameters at the proximal tibia over 3 cycles of pregnancy (P), lactation (L), and post-weaning recovery (R) in reproductive rats (black triangles) and virgins (red squares). (G) Changes in total tibia length over 3 reproductive cycles. Letters indicate significant differences (p<0.05) in cortical parameters among time points for each cycle in the reproductive group (significant differences among time points in the control group are indicated by italic font), and & indicate significant differences in tibia length between consecutive reproductive cycles (p<0.05). Red * indicate differences between reproductive and virgin rats at the end of each cycle (p<0.05); red # indicate trends towards differences between reproductive and virgin rats at the end of each cycle (p<0.1).
