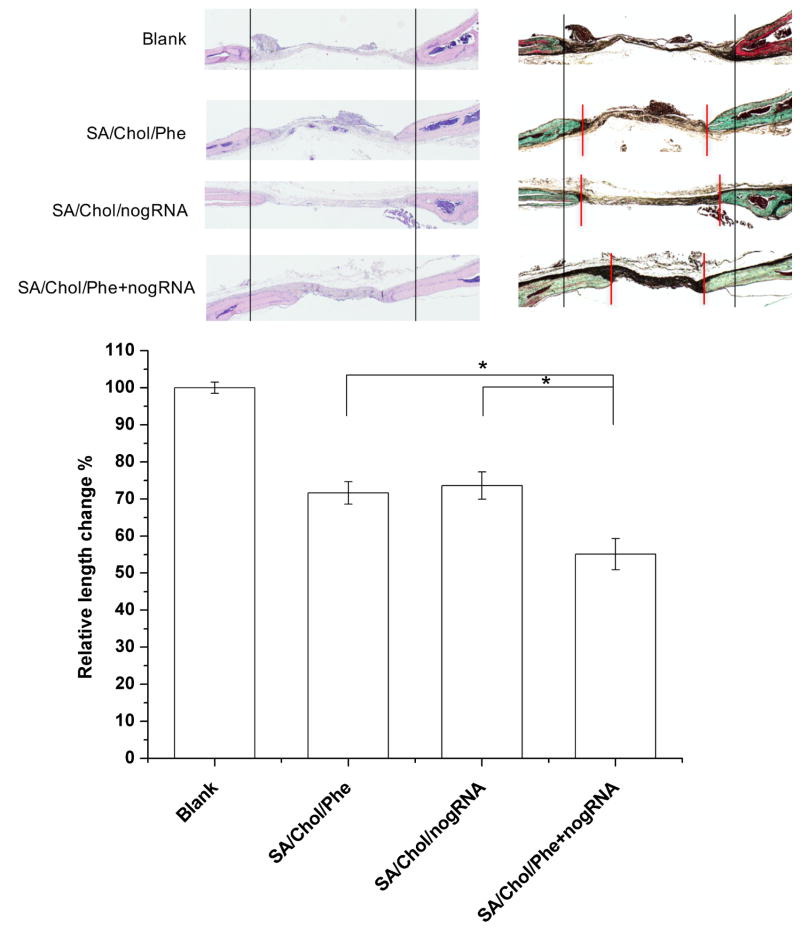
Figure 6.
Histological analysis of bone regeneration in calvarial defects. (A) Hematoxylin-eosin staining (Left), Masson-Goldner trichrome staining (Right). Two black vertical lines were drawn for the ease of observation. (B) The relative length change was measured and normalized to the blank group. Red vertical lines indicate the edges of the advancing bone. (n = 4)

