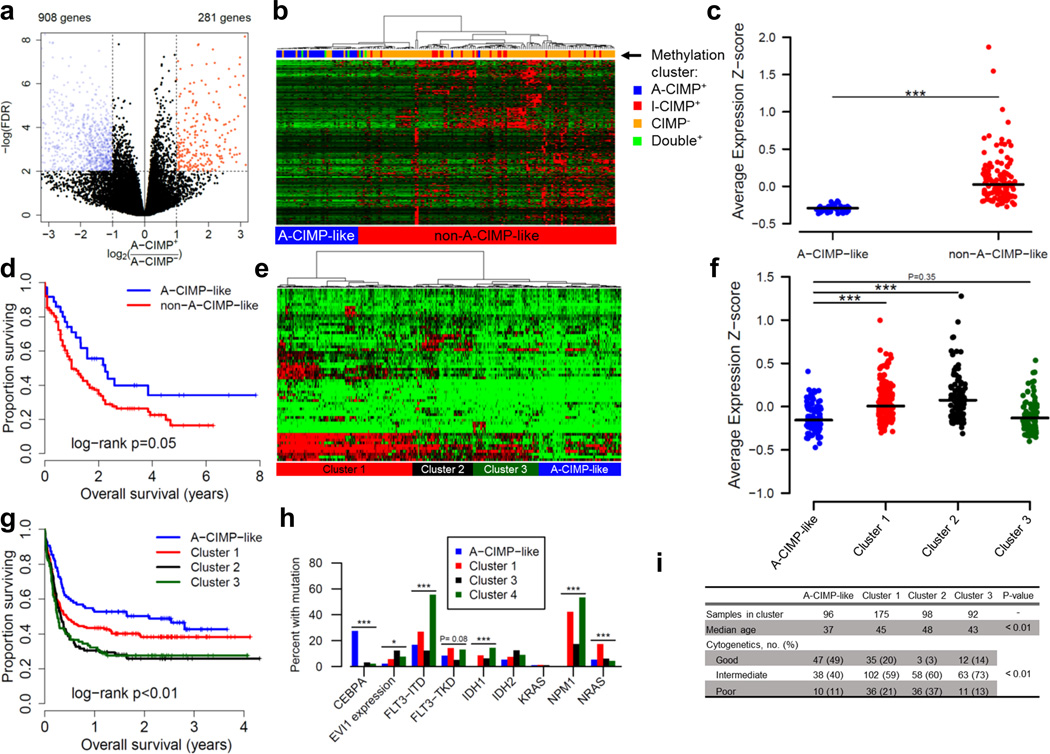
Figure 5. Gene expression program characteristic of A-CIMP is prognostic in multiple datasets.
a) Volcano plot of differential expression analysis comparing TCGA A-CIMP+ to A-CIMP− AML defined by methylation. b) Hierarchical clustering of TCGA cases on RNA-seq data for down-regulated and hypermethylated genes identified in (a). c) Average expression z-scores for clusters in (b). Lines correspond to median z-score values. d) Kaplan-Meier analysis of gene expression clusters. e) Hierarchical clustering of 461 cases from GSE6891 based on down-regulated and hypermethylated genes identified in (a). For clarity, heatmap shows only genes with 80th percentile standard deviation, however clustering was done using all genes. f) Average expression z-scores for clusters in (e). g) Kaplan-Meier analysis of gene expression clusters in (e). h) Molecular characteristics of gene expression clusters in (e). i) Other clinical characteristics associated with gene expression clusters from (e). * P < 0.05, ** P < 0.01, *** P < 0.001.

