Figure 1.

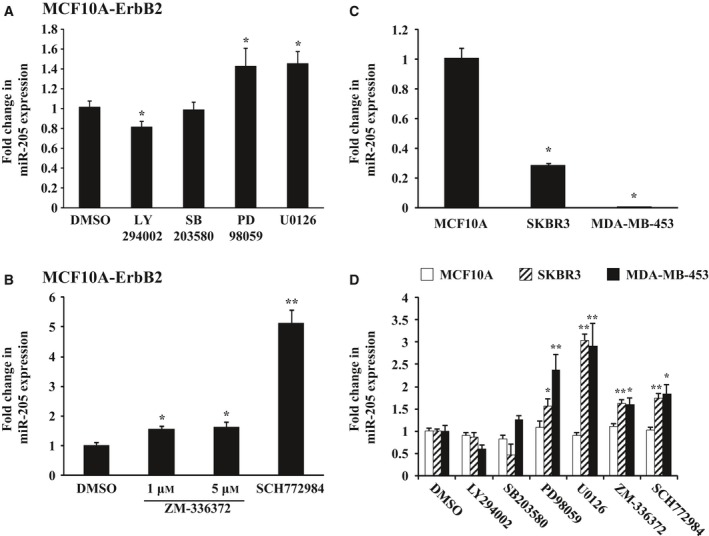
Expression of miR‐205 in MCF10A‐ErbB2, SKBR3, and MDA‐MB‐453 cells treated with ErbB2 signaling pathway inhibitors. Real‐time quantitative RT‐PCR analysis of miR‐205 expression in MCF10A‐ErbB2, SKBR3, and MDA‐MB‐453 cells treated with the indicated inhibitors. (A, D) Cells were treated with PI3K inhibitor LY294002 (50 μm), p38 MAPK inhibitor SB203580 (10 μm), MEK inhibitor U0126 (10 μm), or PD98059 (20 μm) for 48 h. (B, D) Cells were treated with Raf‐1 kinase inhibitor ZM‐336372 (1–5 μm) or ERK inhibitor SCH772984 (1 μm) for 48 h. Data are normalized to DMSO control and represented as mean ± SEM of three independent experiments. *P < 0.05, **P < 0.01 by Student's t‐test compared with DMSO. (C) Analysis in MCF10A, SKBR3, and MDA‐MB‐453 cells Data are mean ± SEM of three independent experiments. *P < 0.01 by Student's t‐test compared with MCF10A.
