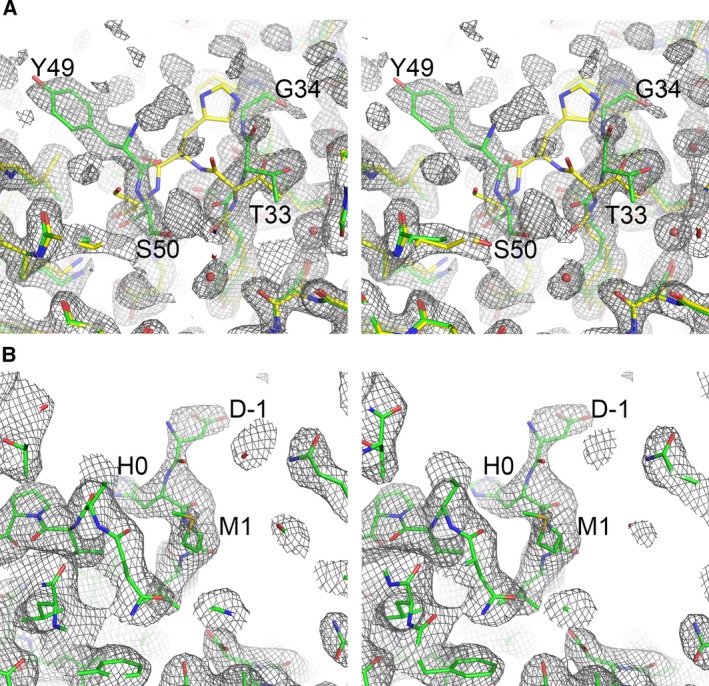
Figure 5.

Stereo diagrams of electron density maps showing density for part of the inserted peptides in Hpf‐E1 (A) and Hpf‐E2 (B). Sections of the electron density maps around the inserted peptides were plotted at a contour level of 1 σ. The maps were calculated using REFMAC, with the inserted peptide residues omitted, at 2.0 Å in (A) and at 2.8 Å in (B). The refined structural models were colored in green. In (A), the Hpf structure, shown in yellow, was superimposed on the refined model. The inserted peptide residues and the immediate border residues of Hpf were labeled.
