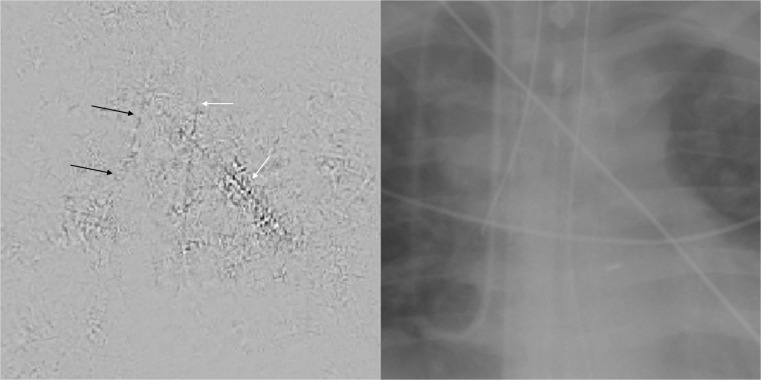
Fig. 10.
Saliency map on the left with corresponding radiograph on the right with low position of ET tube in the right main stem bronchus. On the saliency map, the black arrows point to the location of the ET tube. The white arrows point to an unrelated overlying catheter and an enteric tube. From the saliency map, the ET tube, enteric tube, and overlying catheter all have contributions to the prediction class, indicating that the network is not as well formed and is inferring from parts of the image (enteric tube and overlying catheter) that are not relevant to the prediction label (ET tube is low). This may explain the lower accuracy of this network compared to the others

