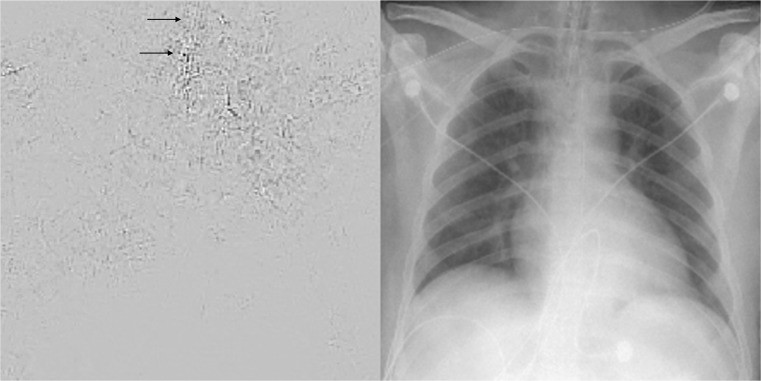
Fig. 9.
Saliency map on the left with corresponding radiograph on the right, where an ET tube is present. The saliency map highlights parts of the images that contribute most to the prediction class. The black arrows points to the location of the ET tube, which has a visible contribution to the prediction label. However, there are other parts of the image, including edges of ribs and the aortic knob that also contribute to the score for this image. While the network had high accuracy, there is still room for improvement

