
Figure 3.
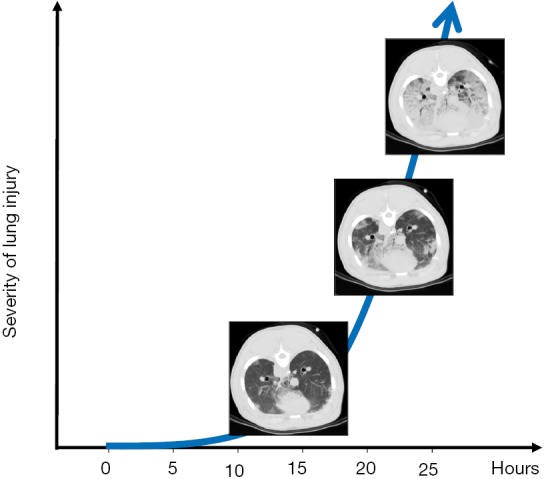
The diagram represents the time-course of experimental ventilator-induced lung injury. As shown, the first lesions appear after 10–15 h and are mainly represented by small CT opacities at the interface between the visceral and the parietal pleura. After 15 h the process becomes exponential and after 25 h the opacities involve all the lung parenchyma (34).