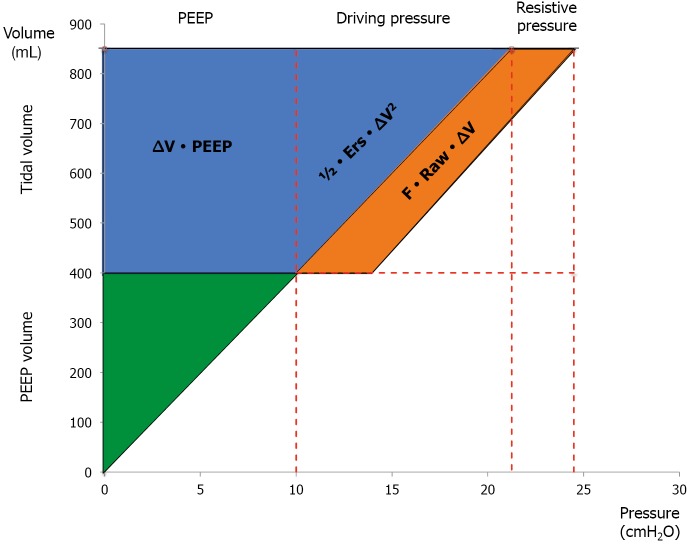
Figure 4.
Graphical representation of the equation of power (22). The upper left rectangle (∆V × PEEP) represents the baseline stretch of the fibers, i.e., the energy level to be overcome at each tidal volume delivery. The blue triangle (1/2 × Ers × ∆V) represents the energy needed to win the elasticity of the respiratory system. The orange parallelogram (F × Raw × ∆V) represents the energy needed to win the resistance to the gas flow. The lower green triangle represents the static component of PEEP (i.e., PEEP multiplied by the PEEP volume), not taking part in the equation of power, as it is delivered just once (at the first application/change of PEEP).

