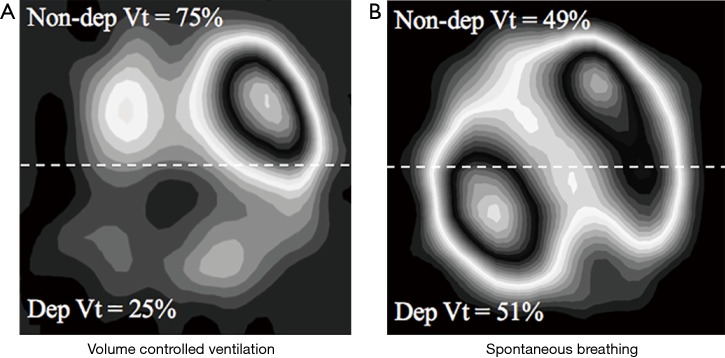
Figure 2.
Effects of controlled ventilation vs. spontaneous breathing on ventilation inhomogeneity. Functional map of distribution of regional tidal ventilation in the chest assessed by electric impedance tomography (EIT): (A) volume controlled ventilation in an intubated patient with set Vt of 500 mL, respiratory rate 16 bpm and PEEP 5 cmH2O. The dependent regions are distended by only 25% of the global Vt, resulting in highly inhomogeneous ventilation distribution; (B) spontaneously breathing non-intubated patient with respiratory rate of 20 bpm and no PEEP. Notice the equal distribution of ventilation between the non-dependent and the dependent lung regions, yielding almost perfectly homogeneous distribution. Vt, tidal volume.

