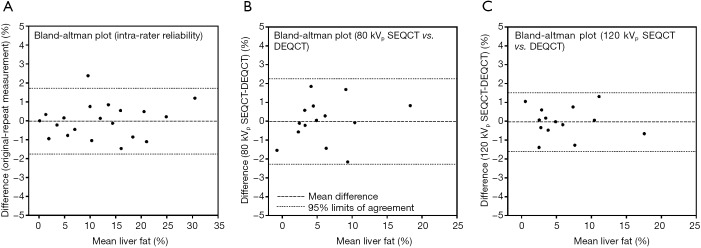
Figure 6.
Bland-Altman plots showing: (A) comparison of the original and repeat estimates of liver fat in the 20 subjects from Shenyang City in the intra-rater reliability study. The 95% limits of agreement shown by the dotted lines were ±1.8%; (B) and (C) comparison of the SEQCT estimates of liver fat in the 14 Jilin City subjects at 80 kVp and 120 kVp with their DEQCT study results plotted in Figure 5A. The 95% limits of agreement were ±2.3% at 80 kVp and ±1.6% at 120 kVp.

