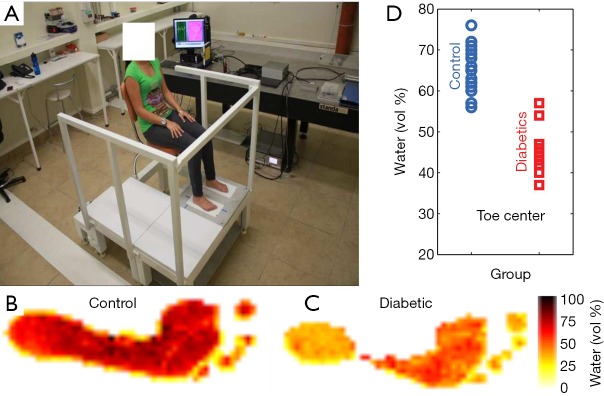
Figure 3.
Diabetic foot measurement studies using THz. (A) Photograph of the measurement set-up. THz images plotting the calculated water volume for (B) a control and (C) a diabetic patient. (D) Calculated water volume for control and diabetic patients using data from the centre of the big toe. Adapted with permission from (22).

