
Figure 3.
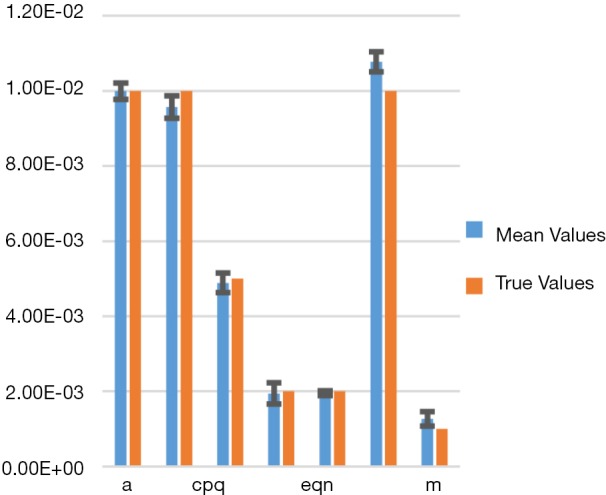
Bar chart showing the true parameters versus the average recovered parameters with standard error. Not all the parameters are annotated for clarity, but from left to right the bars correspond to parameters a, bpq, cpq, d, eqn, f, m.
Official websites use .gov
A
.gov website belongs to an official
government organization in the United States.
Secure .gov websites use HTTPS
A lock (
) or https:// means you've safely
connected to the .gov website. Share sensitive
information only on official, secure websites.
Bar chart showing the true parameters versus the average recovered parameters with standard error. Not all the parameters are annotated for clarity, but from left to right the bars correspond to parameters a, bpq, cpq, d, eqn, f, m.