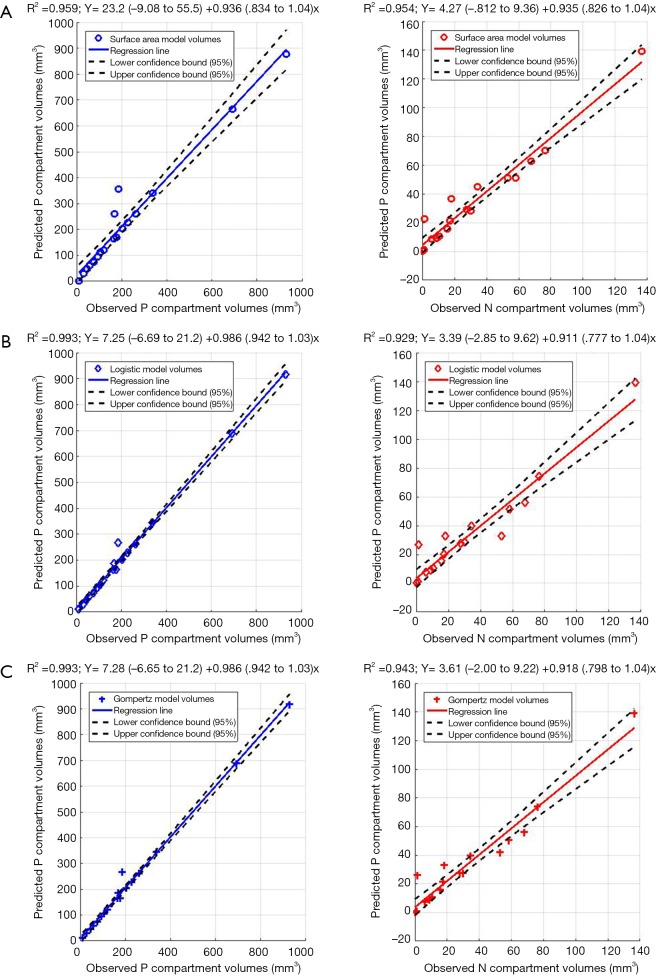
Figure 5.
Linear regression for 18 data points (6 mice, 3 time-points) for P- and N-layers of (A) Model A, (B) Model B, and (C) Model C. 95% confidence bounds are given for all linear regressions and regression equations are expressed as: y = a (95% CI) + b (95% CI) × (where CI stands for confidence interval).

