
Figure 4. Development of T-ALL in the absence of Itpr-Ca2+.
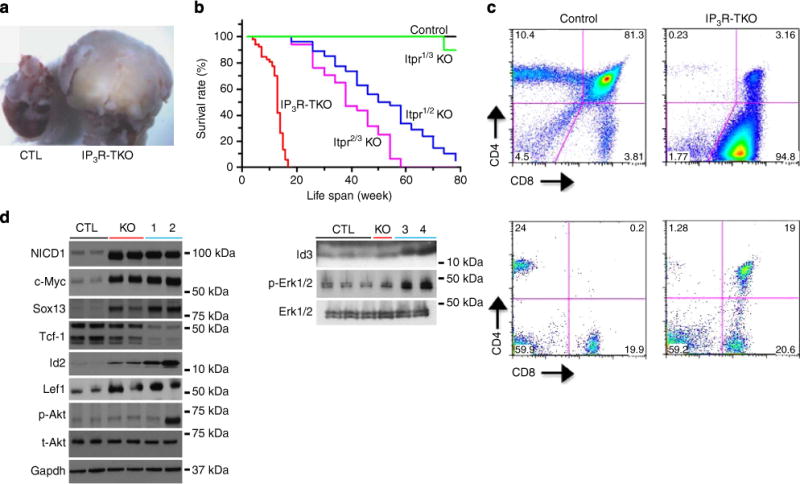
(a) Thymus of adult tumour-bearing IP3R-TKO mouse (right) compared with control thymus (CTL, left). (b) Kaplan–Meier survival curve of double and triple Itpr knockout lines (n>100, IP3R-TKO). Itpr1fl/−Itpr3−/−Tie2-Cre (Itpr1/3 KO), Itpr1fl/flItpr2−/−Tie2-Cre (Itpr1/2 KO) or Itpr2fl/−Itpr3fl/flTie2-Cre (Itpr2/3 KO). (c) Surface CD4 and CD8 expression of control and T-ALL burdened thymi (top) and peripheral blood (bottom) of IP3R-TKO adult animals. (d) Western blotting of cleaved intracellular Notch1 (NICD1), c-Myc, Tcf-1, Sox13, Lef1, Id2, Id3, and total and phosphorylated Erk and Akt in adult control and IP3R-TKO hyperplastic (KO), T-LBL (1, 3) and T-ALL (2, 4) burdened thymi. Data are representative of a minimum of ten (a,c), three (d) and one (b) independent experiments. Hyperplasia, T-LBL and T-ALL were defined by the presence of disease and the extent of extra-thymic tissue involvement. Age was not used to define these stages, as we observed significant variability in the age of onset and age of progression from hyperplasia to T-LBL to T-ALL in IP3R-TKO mice.