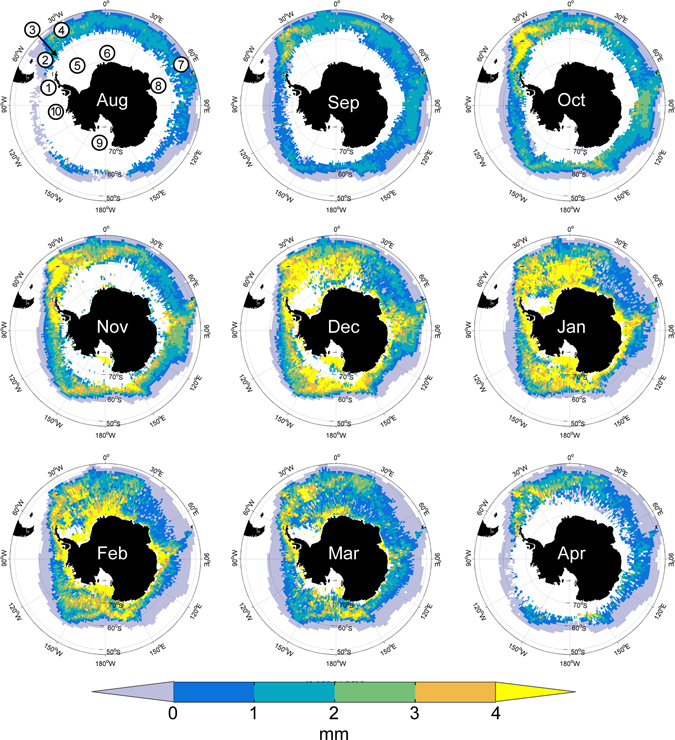
Figure 1.

Mean monthly potential growth (daily growth rate x number of days in month) for 40 mm krill calculated for grid cells where both temperature and chlorophyll a data are available. White shading indicates missing environmental fields or temperature >5 °C. Panel 1 labels: 1 – West Antarctic Peninsula, 2 – Scotia Sea, 3 – South Orkney Islands, 4 – South Georgia, 5 – Weddell Sea, 6 – Lazarev Sea, 7 – Kerguelen Plateau, 8 – Prydz Bay, 9 – Ross Sea, 10 – Amundsen Sea. Figure created with Matlab software version R2013a (www.mathworks.com) using M_Map mapping toolbox version 1.4f (https://www.eoas.ubc.ca/~rich/map.html).
