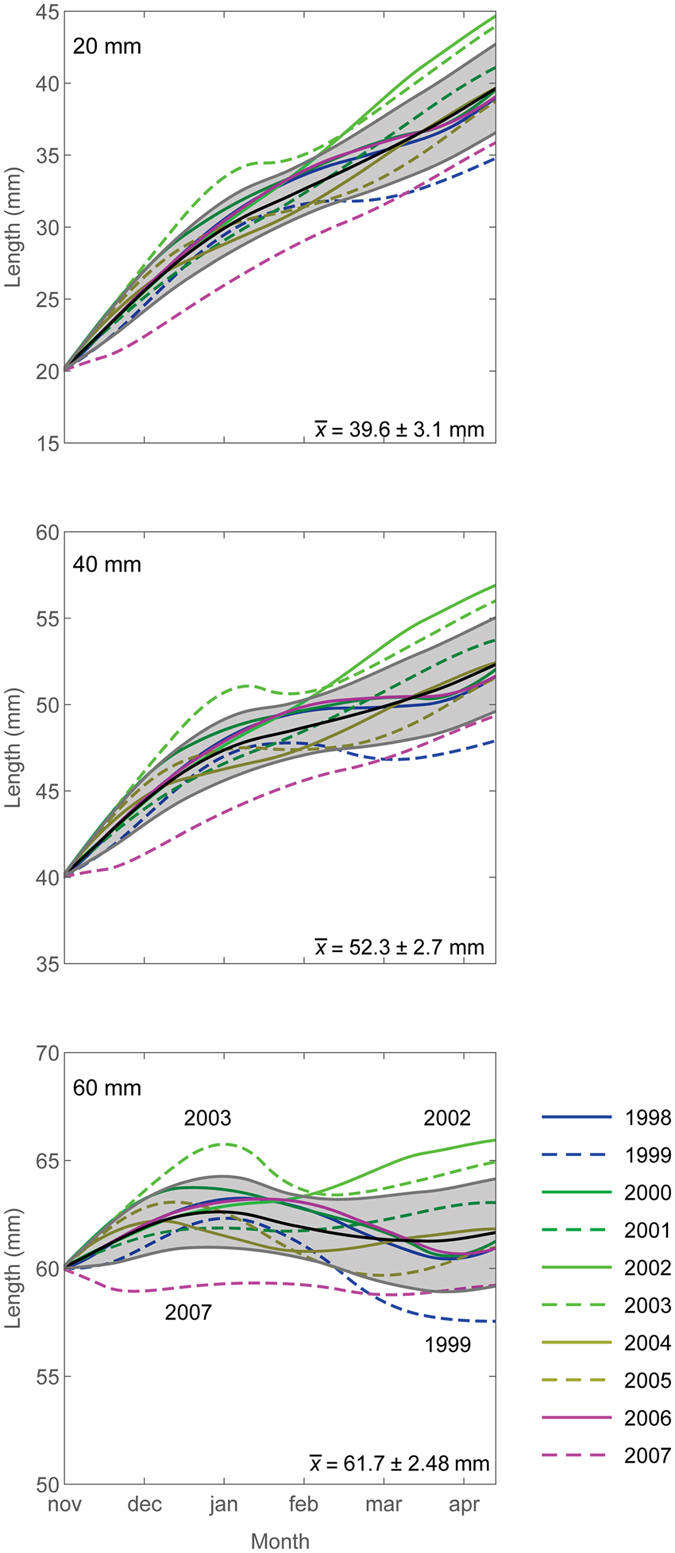
Figure 5.

Growth curves (November to mid-April) from 1998 to 2007 at 54°S, 40°W for krill with initial sizes of 20 mm, 40 mm and 60 mm (1998 = austral summer 1997/1998). The colours show the growth curves for different years (see lower panel for key and annotation) along with the mean (black) and standard deviation (grey shading). Mean +/−1 standard deviation of the krill length by ~mid April (13th April) are shown. Figure created using Wolfram Mathematica version 11 (https://www.wolfram.com/mathematica).
