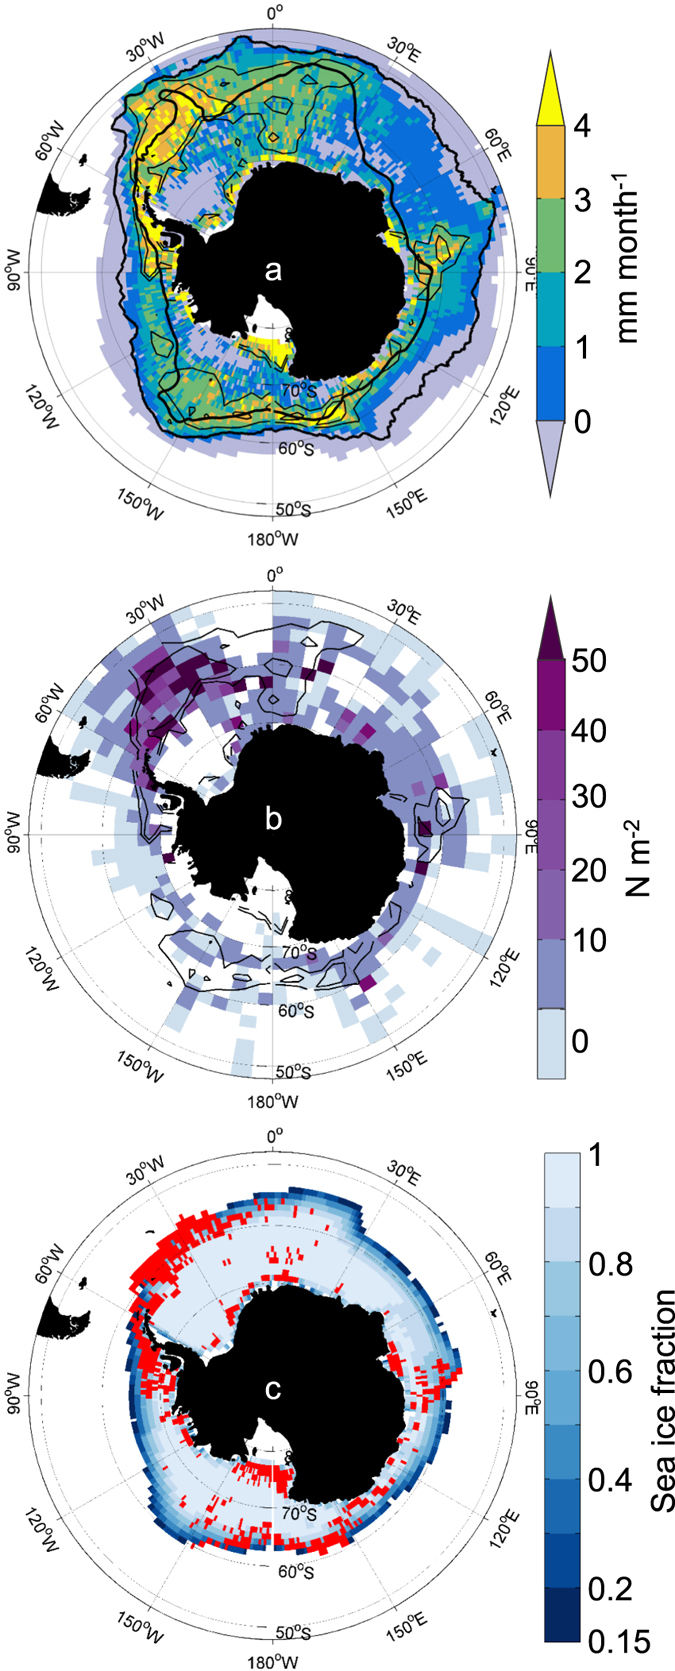
Figure 6.

Circumpolar distributions: (a) Mean monthly potential growth rate of 40 mm krill for November to March (mm month−1); cells with missing data for chl a set to 0 mg m−3. White shading indicates cells with missing environmental data or temperature >5 °C. Contours of mean growth rate of 2 mm month−1 and 3 mm month−1 are derived from a smoothed version of the growth matrix (5° lon × 2° lat; thin black lines). Superimposed with mean positions of Antarctic Circumpolar Current (ACC) fronts70–72: Polar Front and southern boundary of the ACC (thick black lines). (b) Abundance of krill (N m−2) from KRILLBASE69 overlaid with contours of mean growth rate of 2 mm month−1 and 3 mm month−1 from Fig. 6a (thin black lines). (c) Regions where mean monthly potential growth rate of 40 mm krill over November to March exceeding 3 mm month−1 (from Fig. 6a) coincides with sea ice fraction in range 0.15 to 0.75 in any month (red). Background shading shows climatological mean sea ice fraction for October. Figure created with Matlab software version R2013a (www.mathworks.com) using M_Map mapping toolbox version 1.4f (https://www.eoas.ubc.ca/~rich/map.html).
