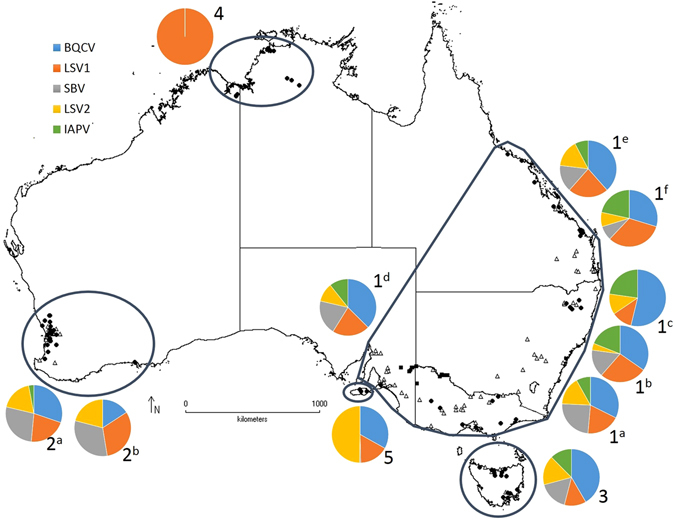
Figure 1.

Map of Australia showing sampling sites (●) and apiary origins (▲) across five regions (1–5) and prevalence of five honeybee viruses detected by RT-PCR in adult honeybee samples. Samples for Region 1 include: a, VIC/NSW-1 August 2013; b, VIC/NSW-2 April 2014; c, VIC/NSW-3 August 2014; d, SA August 2014; e, QLD August 2013; f, QLD October 2014. Samples for Region 2 include g, WA-1 October 2013; h, WA-2 March 2014. Region 3–5 were comprised of single sampling periods. Map was created using DIVA-GIS version 7.5 (www.diva-gis.org).
