
Fig. 4.
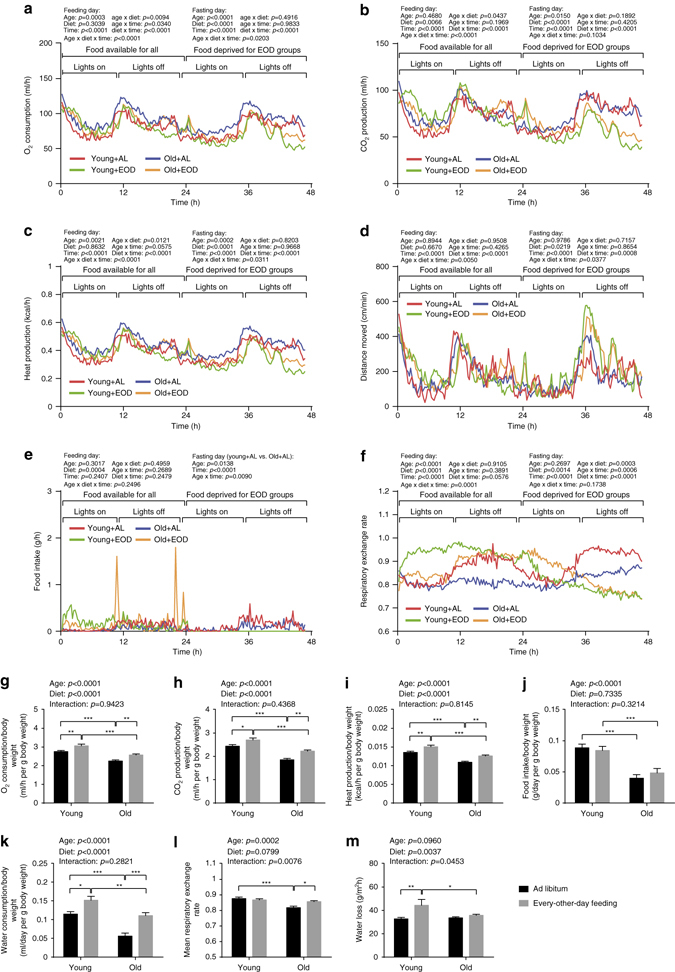
Energy metabolism and water turnover. a–l Indirect calorimetry was conducted over a period of 47 h, initiated at 7 a.m. (young + AL: n = 16, young + EOD: n = 16, old + AL: n = 16, old + EOD: n = 16). The dark/light cycle was kept at 12:12 h (lights on 6 a.m. CET, lights off 6 p.m. CET). For mice assigned to the EOD cohorts, food was removed after the first 24 h. Water was supplied AL to all groups. Temporal pattern of a oxygen consumption, b carbon dioxide production, c HP, d distance moved, e food intake, and f respiratory exchange rate are shown. g Oxygen consumption, h carbon dioxide production, i HP, j food intake, and k water consumption per g body weight as well as l mean respiratory exchange rate were calculated. m TEWL was measured non-invasively using a special Tewameter (young + AL: n = 15, young + EOD: n = 16, old + AL: n = 22, old + EOD: n = 23). Statistical analyses of a–f were performed via three-way ANOVA with the between-subjects factors age (young vs. old), DR (AL vs. EOD) and the within-subjects factor time (Greenhouse-Geisser correction) for feeding and fasting day, respectively. Statistics of g–m were calculated via two-way ANOVA with between-subjects factors age (young vs. old) and DR (AL vs. EOD). AL ad libitum, EOD every-other-day feeding. Data in a–f are presented as mean. Data in g–m are shown as mean ± SEM. The full indirect calorimetry data set is presented in Supplementary Table 13