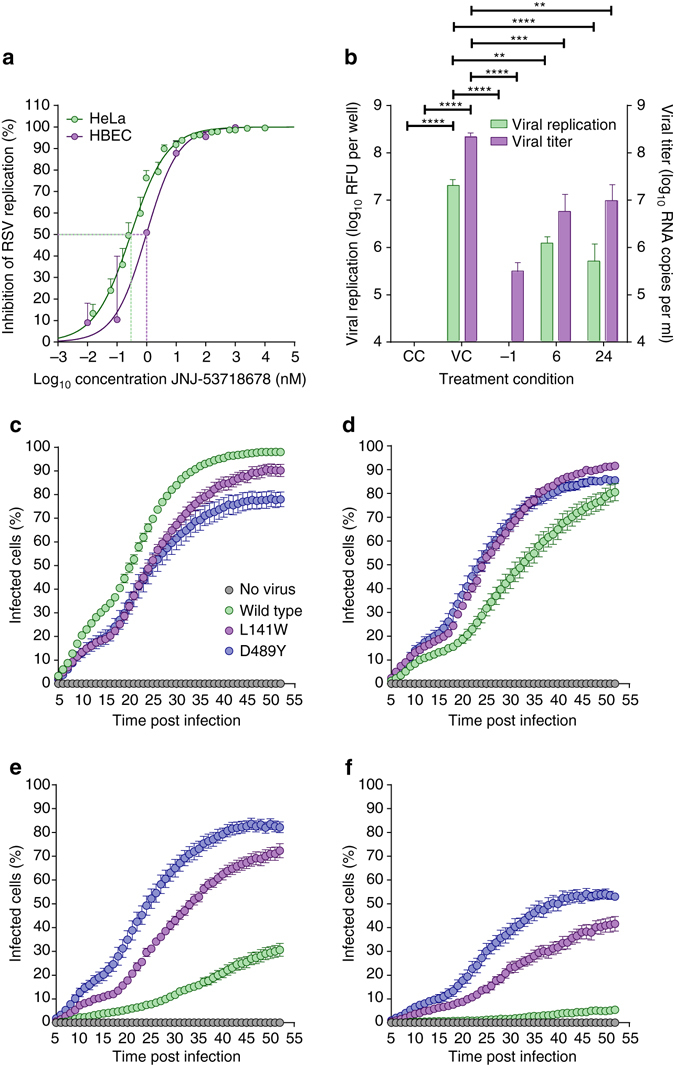
Fig. 2.

JNJ-53718678 inhibits RSV in different cellular infection models. a Concentration-inhibition response curves of JNJ-53718678 obtained from an infection of HeLa cells (green circles and line) or HBECs (purple circles and line) with RSV. Circles and error bars present average values ± s.e.m. (n = 4), respectively. Lines represent the best fit of concentration-inhibition data. Green or purple dotted line indicates the concentration of JNJ-53718678, at which 50% inhibition of infection (EC50) is reached. b Inhibition of RSV in HBECs treated prophylactically or therapeutically with JNJ-53718678. Air–liquid interface cultures of HBECs were infected and treated either with vehicle only (VC), or with 100 nM JNJ-53718678, 1 h before infection (−1), or 6 or 24 h after infection. As a negative control, non-infected, vehicle only-treated cells (CC) were included in the experiment. The effect of JNJ-53718678 was measured on both intracellular viral replication (green bars) as well as viral titer (purple bars) in the culture supernatant. Bars represent mean + s.e.m. (n = 5). Statistical analysis was performed by one-way ANOVA followed by Dunnett’s post hoc test. **p < 0.0025, ***p = 0.0005, ****p < 0.0001. Values of CC and −1 groups (viral replication) dropped below fluorescence threshold value = 60 relative fluorescence unit (RFU) per well, while CC values (viral titer) were below 200 RNA copies per ml. c–f The percentage of A549 cells infected with either wild-type rgRSV224 (green circles) or inhibitor-escape variants (L141W (purple circles) or D489Y (blue circles)) was measured by analyzing GFP-expressing cells in the cultures every 60 min for 48 h, starting five hours after infection in the absence c or presence of 0.001 d, 0.1 e, or 10 f µM JNJ-53718678. As a negative control for infection, GFP expression in non-infected cells (grey circles) was measured. Circles and error bars are mean ± s.e.m. (n = 3). To assess the virus and concentration effect on the AUC of the percentage infected cells vs. time profiles, a linear model was fit with main effects for virus type, compound concentration, and experiment and interaction effects for virus type and compound concentration. Subsequent statistical analysis was performed by contrast testing based on the modeled results. The obtained p-values were Bonferonni-corrected to account for multiple testing
