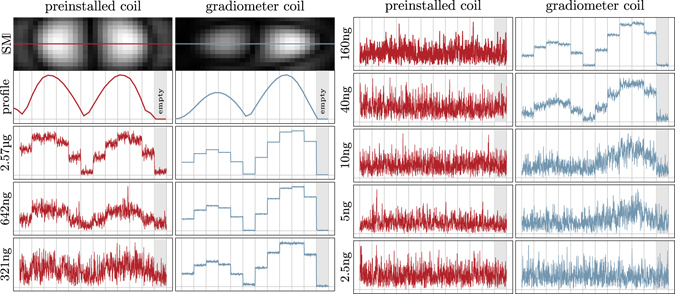
Figure 5.

Raw data analysis. The first image shows the absolute value of the SM component with the highest SNR for the preinstalled coil and the gradiometer coil. As the dilution samples are moved on the x axis, the resulting harmonic magnitude over time are expected to match the profile of these patterns shown in the second plot. The dilution raw data plots contain the unprocessed time data of the selected harmonics for the dilution samples at 11 positions in the FOV and a 12th position outside the scanner bore. Thus, the last part of the plot is actually an empty measurement. It is visible that the gradiometer is misplaced slightly causing a non-symmetric influence of the coil sensitivity.
