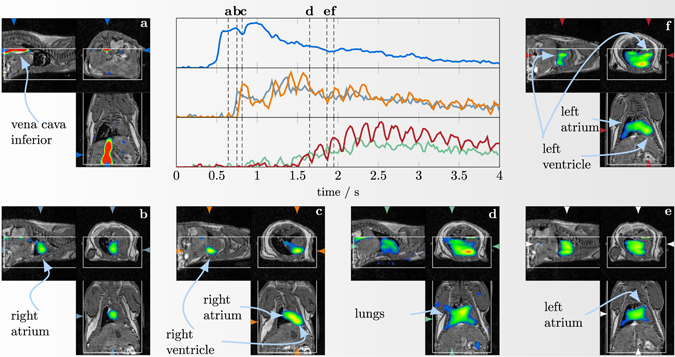
Figure 9.

4D in vivo reconstruction results of the bolus experiment with the highest concentration (51.2 μg/10 μL) at a time resolution of 21.41 ms. Shown are selected image fusions that reveal how the bolus passes through the mouse heart. The white box inside the images indicate the MPI FOV. Additionally, at the center the temporal progression of the signal in different selected structures (vena cava (top), right atrium and right ventricle (middle), left atrium and left ventricle (bottom)) are shown. See Supplementary video S3 for an animated version of this figure.
