
Figure 2.
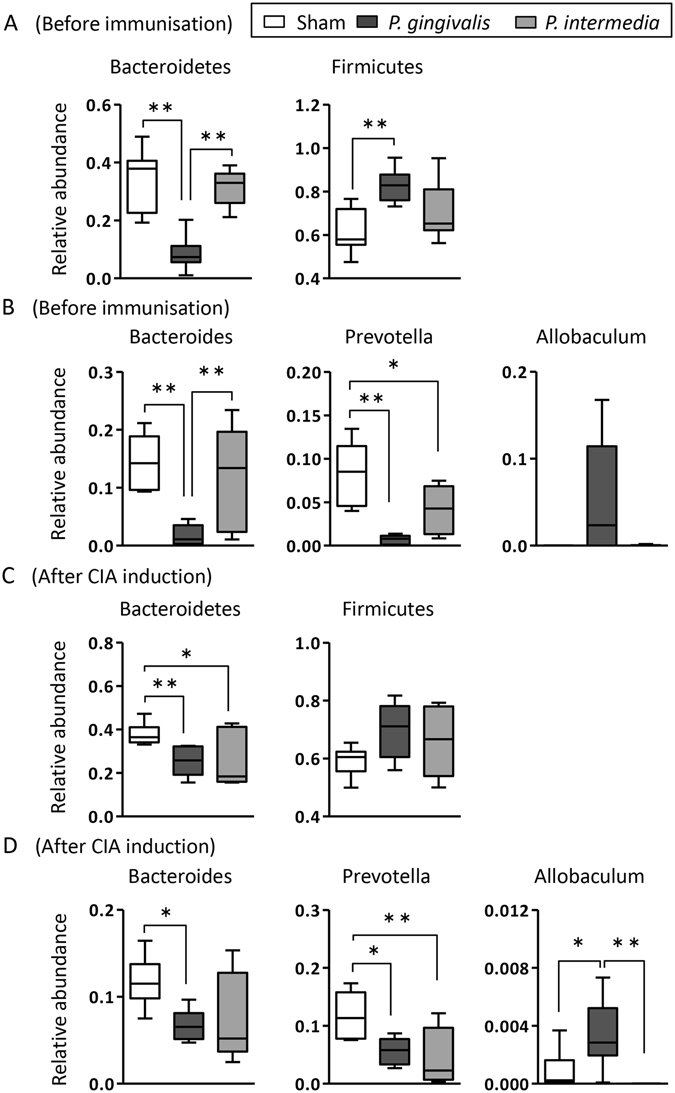
Analysis of the gut microbiota composition in sham-, P. gingivalis-, and P. intermedia-administered mice by 16S rRNA sequencing. Analyses were carried out using faeces obtained before immunisation (day 35; (A and B)) and after induction of CIA (day 77; (C and D)). Relative abundances of each bacterial group at the phylum level before immunisation (day 35; A) and after induction of CIA (day 77; (C)) are indicated by box plots. *p < 0.05, **p < 0.01, One-way ANOVA with Bonferroni corrections for multiple comparisons. Box plot showing the relative abundance of the three bacterial genera found in treatment group before immunisation (day 35; B) and after induction of CIA (day 77; D). Bacteroides, Prevotella, and Allobaculum are represented as percentages on the Y-axis. *p < 0.05, **p < 0.01, One-way ANOVA with Bonferroni corrections for multiple comparisons.