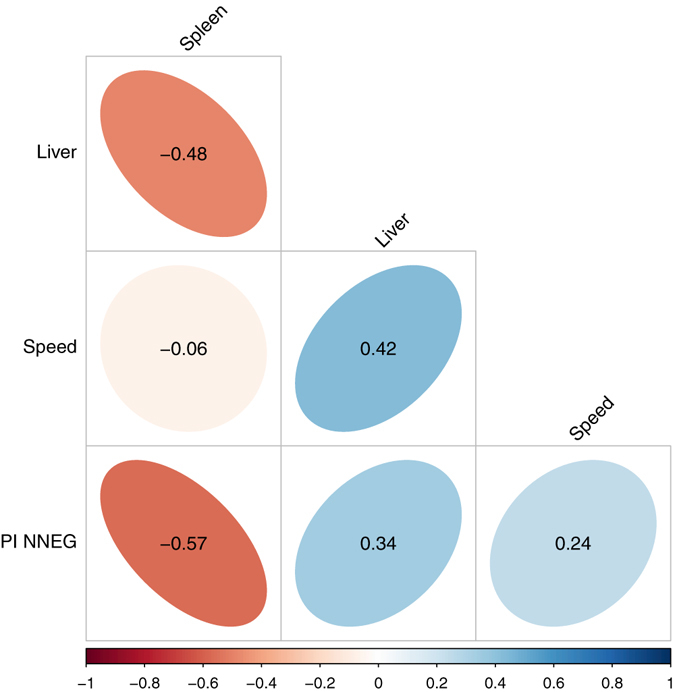
Figure 3.

Relative spleen size is negatively correlated with pessimism. Visualisation of the Pearson correlations between: relative liver weight, relative spleen weight, speed (i.e. mean latency to displace cones at POS and NEG locations in the cognitive bias test) and the pessimism index for the NNEG trials (PI NNEG; see text for details). The shape and colour of the ellipses represent the direction and strength of the correlations; Pearson correlation coefficients are given in the centre of each ellipse. The critical value of r for significance (at P < 0.05) in a two-tailed Pearson correlation with 12 df is equal to ±0.53. Thus, the only significant correlation is that between relative spleen weight and the Pessimism Index.
