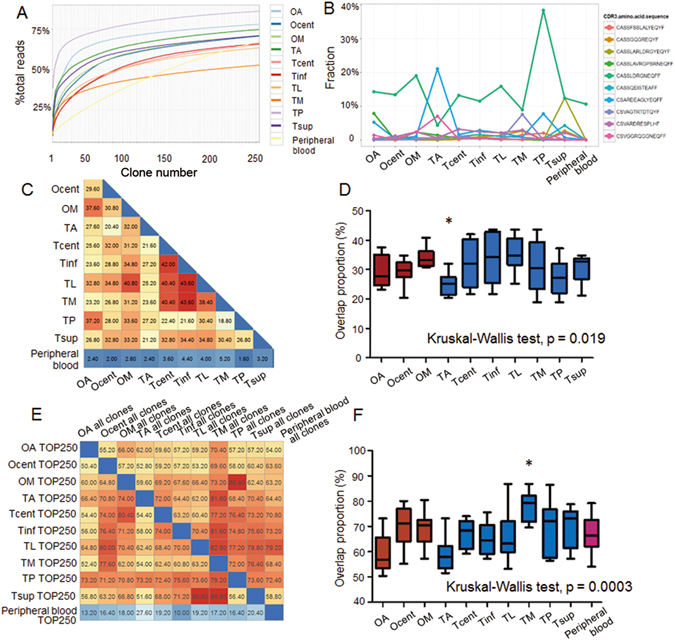
Figure 3.

Distribution characteristics and heterogeneity of the TCR repertoires of Patient 1. (A) Cumulative size of the TOP250. The x-axis depicts the number of clones included (always starting from the most expanded clones). The y-axis shows the percentage of TCRB sequences that are covered by the included clones. (B) Frequencies of the ten most abundant common TCRB clones. The y-axis shows the percentage of the corresponding clone. The pairwise overlaps of the TOP250 among all samples are shown in (C). The boxplot of the overlaps of each sample with other samples according to the results from (C) is shown in (D). The pairwise overlaps of the TOP250 in one sample with the entire repertoire of the other samples are displayed in (E). The boxplot of the overlaps of each sample according to the results from (E) is shown in (F). Significant differences are marked by an asterisk (*).
