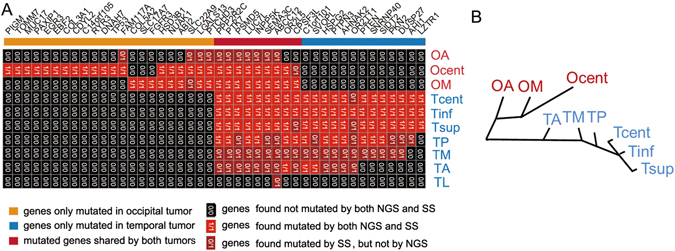
Figure 4.

Genetic intra- and inter-tumor heterogeneity and phylogeny in Patient 1. (A) The regional distribution of 44 nonsynonymous point mutations in ten tumor samples. The heat map indicates the presence of a mutation (red/dark red) or its absence (black) in each region. The numbers in each cell indicate whether mutation presence was validated by NGS, Sanger sequencing (SS) or both. The color bars above the heat map indicate the classification of mutations according to whether they are unique or shared among regions. (B) shows phylogenetic relationships of the tumor regions; branch lengths are proportional to the number of nonsynonymous mutations separating the branching points.
