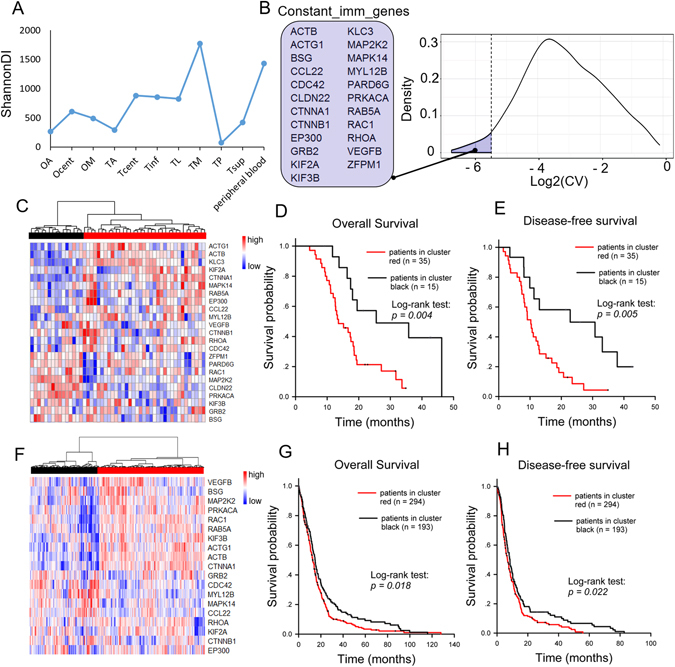
Figure 5.

Discovery of the Constant_imm_genes and validation of their clinical prognostic significance. (A) ShannonDI of the samples. (B) The right panel shows the log2-transformed CV of the expression level of genes belonging to the pathways listed in Table 1. The dotted line indicates the selected cut-off threshold of −5.5, which defines the Constant_imm_genes listed in the left panel. (C) Fifty GBM patients were classified into two major groups (red and black clusters) by unsupervised hierarchical clustering according to the expression pattern of the Constant_imm_genes. The expression levels of these genes are illustrated as a color spectrum, with red, white and blue representing high, medium and low expression, respectively. Kaplan-Meier survival curves and log-rank tests were used to estimate the overall survival (D) and disease-free survival (E) of the two clusters of patients. A similar analysis was applied to the public TCGA GBM datasets, and the results are shown in panels (F–H).
